I've been using DESeq2 to compare two experiments, each with 3 biological replicates. I read in a Counts Table generated from Salmon. I've been doing this successfully for awhile, but my most recent iteration generated unusually high padj values that appear to repeat. I do see that there is fairly high variance between replicates, but I am still concerned about the repetitive adjusted p-values.
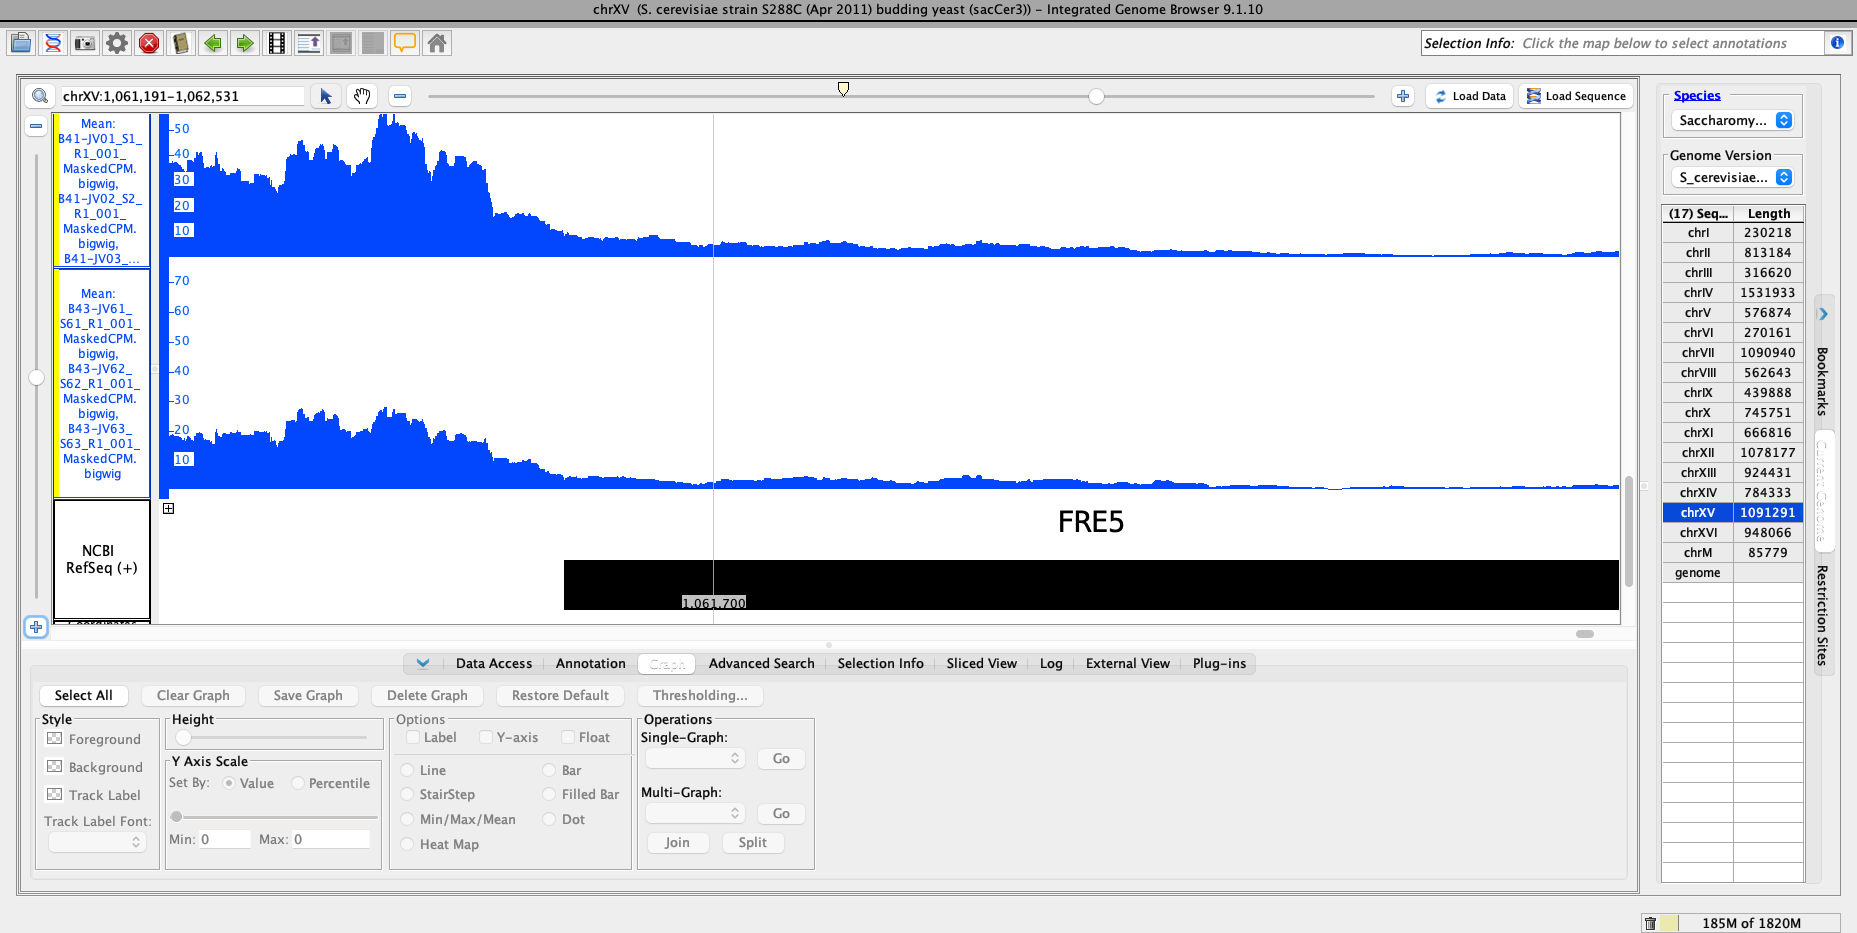
I provide the Salmon TPM values for a subset of genes as well as the results table values for the same genes. I also included a plot of the average TPM for promoter region of YOR384W (FRE5), which is what is being compared in DESeq2.
Any ideas what would cause this?
Salmon_TPM>
| Systematic_Name | Control_Rep1 | Control_Rep2 | Control_Rep3 | Treat_Rep1 | Treat_Rep2 | Treat_Rep3 |
|-----------------|--------------|--------------|--------------|------------|------------|------------|
| YGR248W         |      267     |      209     |      62      |     85     |     125    |     79     |
| YOR382W         |     1042     |      782     |      881     |     730    |     495    |     188    |
| YIL177C         |      39      |      65      |      114     |     47     |     11     |     55     |
| YOR384W         |      467     |      306     |      298     |     287    |     183    |     62     |
| YOR383C         |      750     |      545     |      552     |     505    |     275    |     104    |
results
| Systematic_Name | baseMean   | log2FoldChange | lfcSE      | stat       | pvalue     | padj       |
|-----------------|------------|----------------|------------|------------|------------|------------|
| YGR248W         | 115.965836 | -0.9466166     | 0.63218359 | -1.4973762 | 0.13429541 | 0.99900383 |
| YOR382W         | 576.571724 | -0.9655897     | 0.5582379  | -1.72971   | 0.08368211 | 0.99900383 |
| YIL177C         | 45.700002  | -0.9750884     | 0.75164814 | -1.2972671 | 0.19453931 | 0.99900383 |
| YOR384W         | 224.768808 | -1.0449252     | 0.63880699 | -1.6357448 | 0.101893   | 0.99900383 |
| YOR383C         | 383.045555 | -1.0911254     | 0.63852903 | -1.7088109 | 0.08748599 | 0.99900383 |


Hi Michael,
Thanks for the link to the prior post. I was searching for DESeq posts so I missed that thread. However, it is still unclear to me whether I am getting reasonable numbers in my results file: there appears to be a clear difference in the promoter region of YOR384W (FRE5), which is what I've compared in the given example. Yet, the pvalue and adjusted pvalue are not significant.
Is it possible to access values for each sample for a given gene from either the tximport or dds? The tximport seems to lack Gene ID's, but I do see all of the information within the subsequent dds. Just cant figure out a way to access it.
I'd like to reproduce the statistical test for this gene to confirm the outcomes.
Thanks!
You want to plot the counts you mean? plotCounts?
I was able to find it:
A simple t-test using the CPM values for that gene gives a p-value of 0.03. I'm thinking that high variance in one of the replicates from each Group is the cause for a lack of statistical significance. The PCA hints at this too, though I wasn't sure because the Treatment is not expected to induce many changes genome-wide and therefore relatively low variance across the board may exaggerate differences on PCA (i.e. this could be illustrating technical variance).
Is there a way to pull out genes from the two samples (upper right of PCA) that are causing them to group together?
You can manually compute PCA and look at the factor loadings if you want to investigate, but I'm not sure you'll get much insight that would change the 3 vs 3 analysis.
I was more interested in seeing the Genes that explain the variance in PC1. They might reveal what (if anything) might have gone wrong during biological manipulation for those replicates. Is there a way to do that?
Yes, you can obtain the loadings with
prcomp, see theplotPCAcode (read ?plotPCA) and then maybe ask someone who is familiar with R for some pointers, or you can explore the object yourself and read ?prcomp.