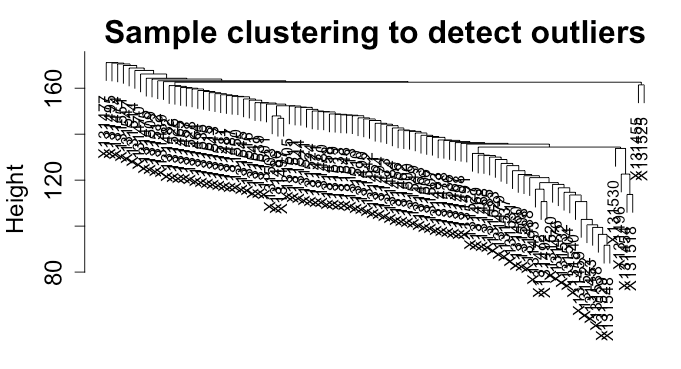
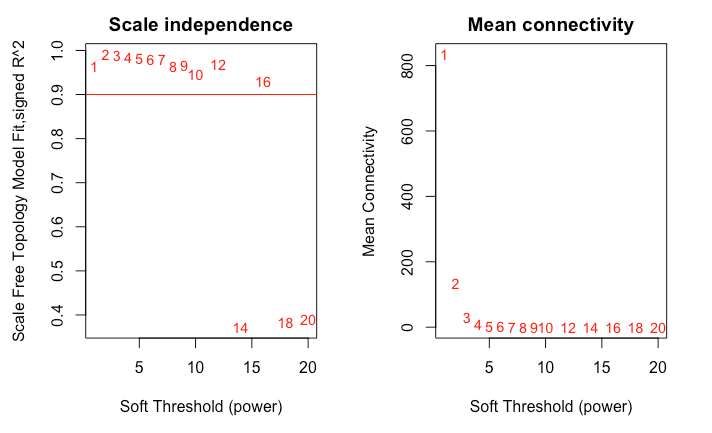
Hello! Im following the Horvath WGCNA tutorial for step-by-step network construction, and when I examine the results from pickSoftThreshold() it shows problematic SFT model fit values. I have a data set of 95 samples and 8,347 genes, so I am expecting a suggested power of 6 or greater. I dont think this is due to an artifact from my samples, as they are all very close after filtering (dendrogram included). Just to see, I proceeded make the TOM dendrograms using power=1 and power=6, and Im worried that something is wrong with my data.
Any ideas of why this is happening and how to proceed?
```{r}
how I normalized:
Keep <- rowSums( counts(dds, normalized=TRUE) > 1 ) >= 50 relaxedSet <- dds[Keep,]
dds <- DESeq(relaxedSet) vsdRelax <- vst(relaxedSet, blind=FALSE)
Im using RNAseq expression data that is variance-stabilizing transformed and has low-count genes removed. There are no batch effects (all seq'd on the same run).
Im using this tutorial: https://horvath.genetics.ucla.edu/html/CoexpressionNetwork/Rpackages/WGCNA/Tutorials/FemaleLiver-02-networkConstr-man.pdf
sessionInfo() R version 4.1.2 (2021-11-01) Platform: x86_64-apple-darwin17.0 (64-bit) Running under: macOS High Sierra 10.13.6
Matrix products: default BLAS: /System/Library/Frameworks/Accelerate.framework/Versions/A/Frameworks/vecLib.framework/Versions/A/libBLAS.dylib LAPACK: /Library/Frameworks/R.framework/Versions/4.1/Resources/lib/libRlapack.dylib


Hi, it seems that your data are very strongly correlated. I'm total noob in this analysis but I'm sure that if you describe your design and data (what groups, treatments) more througly you could get better response from someone more informed. In fact the lack of such information have made good response impossible. Now it is surely too late for help in this analysis but, please remember to descibe your design better in future questions.