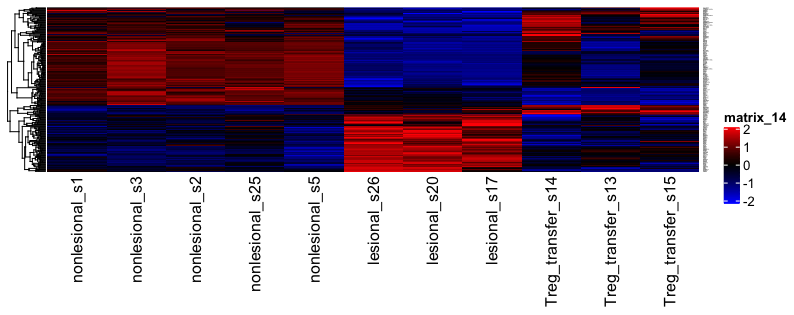
Hello,
I'm using DESeq2 already since some time, and I thought that I understand the procedure, but now I've stumbled upon a small problem, where I'm not sure how to proceed.
I have in my comparison 3 groups (healthy, lesional, treated), where I want to detect the genes, which are differentially expressed between healthy vs lesional, and lesional vs treated.
I'm interested in the genes which are overexpressed in lesion, but downregulated by treatment, or other way round. My problem is: I do Wald tests for 2 comparisons (healthy vs lesion, lesion vs treated) and I want to create a heatmap of differentially expressed genes (kind of time course experiment). However, if I take dds results with reference="healthy", then everything is compared to "healthy" cohort, and the data in the heatmap also displays comparison to ''healthy". What would be the best way of doing that? Theoretically, if I would take "lesion" as reference, it could solve the problem, but it would display inverse correlations...
I thought of extracting assay data from these 2 Wald tests for the genes, overlapping between 2 groups, then merge the data and create Heatmap. In this case, should I take raw counts and then perform normalization, or take already normalized values? Or is LRT the better way? I suppose it has already been discussed once, but I could not find an answer to that question.
Thank you


Sorry, I think it was my mistake - false understanding of the produced heatmap.