How to use bootRanges to bootstrap small RNA loci (nullranges package)
3
0
Entering edit mode
Poonam • 0
@e9336529
Last seen 9 hours ago
India

Dear authors,

I came across your null ranges function. Kindly address my doubts.

I have a small RNA loci data and i want to test the association with other genomic feature. I want to generate bootstrapped data for my small RNA loci. One way of doing is to perform subsampling and another way is using bootRanges.

  1. gr1 is my granges data representing my small RNA loci. I want to bootstrap only these regions because other regions are not small RNA loci. Therefore, i added the background genome coordinates to the exclude option (gr_toexclude). Is it right?

  2. How do i select block length??? If you say i can share my loci data so that you can help me in deciding the block length.

p1 = bootRanges(gr1, 
  blockLength=100, R=100,  
  exclude=gr_to_exclude, 
  type="bootstrap",  
  withinChrom=TRUE)
bootRanges nullranges • 2.8k views
ADD COMMENT
0
Entering edit mode
@mikelove
Last seen 12 hours ago
United States

Thread #1

Thanks for posting here.

So you want to move the small RNA loci around the genome? Do they tend to cluster?

For mouse or human genome we usually use a block length around 200 to 500 kb, and we usually use a simple genome segmentation based on gene density with excluded regions from the excluderanges package.

ADD COMMENT
0
Entering edit mode

yes, they exist in clusters. How it should be done for a clustered data??

I used block length from 100bp, 5000bp, 10000bp, 100000bp, 1000000bps. As i am increasing the block length after 10000bp, the bootranges comes with zero width. Can you please explain me what this block length is doing?? what it should be for a clustered data??

ADD REPLY
0
Entering edit mode

Let's discuss a few of the points of bootRanges:

  • blockLength - you want this to be larger than the typical clustering pattern but smaller than the region you are tiling with blocks. We used a large segmentation of hg38, e.g. >1Mb contiguous segments, and found that 200-500 kb blocks worked well.
  • seg - you can choose which blocks go where, or what parts of the genome to bootstrap. We typically bootstrap the entire genome, but you can bootstrap smaller segments only, I am still not sure where you want to place your bootstrapped features. Can you explain more about this choice for your data?
  • exclude - you can additionally specify places that features should not be placed, in addition to how you specify the segmentation.

Maybe you can give me an example of a locus and also the genomic context, and where you want the bootstrapped features to be placed. There is a lot of flexibility in this package, as there are many different use cases (e.g. whether the features live in genome space or transcript space, etc.).

ADD REPLY
0
Entering edit mode

Thank you for your response. I will share the data through email. I will share bootranges outcome also.

ADD REPLY
0
Entering edit mode

If you want a default analysis, you can use the example in the quick start:

https://nullranges.github.io/nullranges/articles/bootRanges.html#quick-start

Here we use a basic segmentation for hg38 and some recommended excluded regions, with block length of 500kb.

We bootstrap across chromosome typically (meaning a feature from chromosome A can be placed on chromosome B in the bootstrapping). Is there a reason why you don't want to do that?

ADD REPLY
0
Entering edit mode

I thought of keeping it the way it is, otherwise there is no specific reason for within chromsome bootstrapping.

ADD REPLY
0
Entering edit mode

I'd recommend to keep that argument as default:

withinChrom = FALSE

ADD REPLY
0
Entering edit mode

Okay. I will do that.

ADD REPLY
0
Entering edit mode

Hello Dr. Michael,

I did the analysis with withinChrom=FALSE

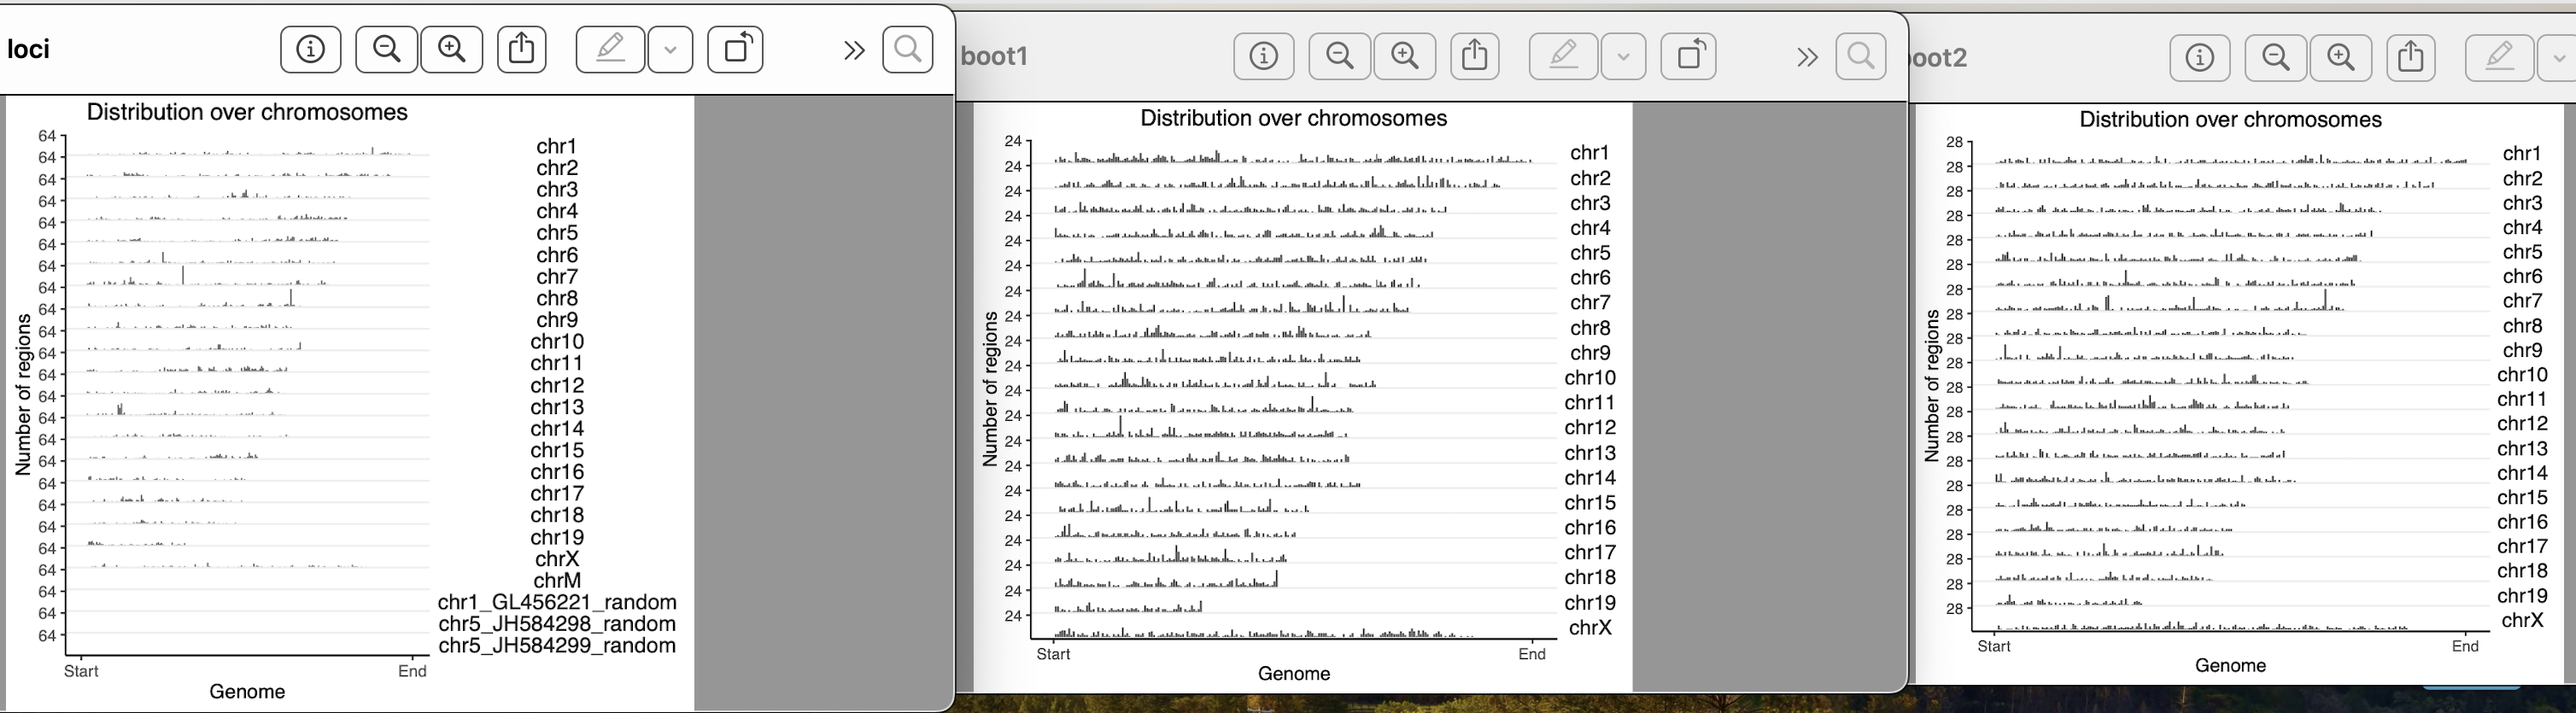
How do you calculate inter range or inter feature distance? how do you take care of the different chromosomes? Because by any mean your boot ranges data does not look like your original data. In the original data the locus were apart and there were no clashes. In the bootranges generated data from one locus it has made three entries in different iters. If i take all iter to calculate inter range distance, it is less than the original. How should i calculate it?

ADD REPLY
0
Entering edit mode

We have a part of the bootRanges vignette where we assess the distance between subsequent ranges. Importantly, this is done per iteration, not across all iterations. It's probably sufficient to just look at one iteration, here we look at three:

https://nullranges.github.io/nullranges/articles/bootRanges.html#assessing-quality-of-bootstrap-samples

The bootstrapped ranges are supposed to look roughly similar in terms of this distribution to the original data, if everything has been set up correctly.

ADD REPLY
0
Entering edit mode

Thank you for your help Dr. Michael.

One more doubt, my original loci contains 7000 locus on different chromosomes. When i am generating bootranges one iteration has only 10-13 locus entries on different chromosomes. Is it okay?

ADD REPLY
0
Entering edit mode

The number should be roughly 7000 across the iterations.

Can you show table(seqnames(gr)) for the original and for one iteration of the bootstrap?

ADD REPLY
0
Entering edit mode
> table(seqnames(gr1))  #original data

 chr1 chr10 chr11 chr12 chr13 chr14 chr15 chr16 chr17 chr18 
  515   350   574   312   377   268   300   255   323   231 
chr19  chr2  chr3  chr4  chr5  chr6  chr7  chr8  chr9  chrX 
  228   538   405   521   483   396   518   401   382   315 
 chrY 
    9 

> table(seqnames(p6))  #this is for all iterations (1000)

 chr1 chr10 chr11 chr12 chr13 chr14 chr15 chr16 chr17 chr18 
  808   325   616   253   345   418   259   414   395   191 
chr19  chr2  chr3  chr4  chr5  chr6  chr7  chr8  chr9  chrX 
  236  1269   443  1196   878   461   753   409   535   362 
 chrY 
   50

Sorry, i was not able to fetch the seqnames number per iter. The following image represents first iteration

ADD REPLY
0
Entering edit mode

You can do R=1 if you want to just look at a single iteration.

My guess is that you are losing >99% of the bootstrapped data to excluded regions. We thought of the excluded regions as e.g. telomere, centromere, just a small number of places where it doesn't make sense to put blocks.

What do you have for sum(width(excluded))?

It may help me to understand: how you are defining the excluded regions?

ADD REPLY
0
Entering edit mode

sum(width(gr_toexclude)) [1] 2713499861

I excluded everything which was not locus. If small rna locus is from 2000 to 4000 and next locus is from 5000 to 6000, i excluded 1 to 2000 and then 4000 too 5000 and defined chr length as the last granges number for that chromosome.

ADD REPLY
0
Entering edit mode
@mikelove
Last seen 12 hours ago
United States

Thread #2

Starting a new thread. If you want to sample from a small region of the genome and only place features in that same small region of the genome, you should use seg instead of exclude. This gives a segmentation of the genome that instructs where bootRanges should allow sampling from and to. So then if you imagine a genome with states 1 and 2 (there can be more, but it's enough to just have two states):

[---1---][---2---][---1---]

ranges will be sampled from these states above
and only placed into matching states below

[---1---][---2---][---1---]

A feature is allowed to be placed from the left 1 state into the right 1 state, but the number has to match.

A segmentation is just a GRanges object that covers the genome and has a metadata column state that instructs where to place ranges.

If you want to control where the features are placed, seg is the argument to use. exclude is just a filter at the end to remove any features that overlap a region, but you want to be in control of where they are placed, not just filter at the end.

ADD COMMENT
0
Entering edit mode

Thank you Dr. Michael for all this help. A little more please...

I think I have a lot of questions, which are related to each other. My first confusion also relates to whether I have been able to understand the concept clearly. I am trying to put all of them here in minimum words. Kindly let me know if I am right and where I am wrong, if so;

I am dealing with two features (small RNA and DNA methylation).

I aim to look for their overlap and want to rule out a chance overlap.

By doing nullranges, I am trying to generate ‘null’ data which will be used for hypothesis testing that my two features have real overlaps (not by chance). Nullranges leaves one feature in the background and segments the genome into ‘states’ as per the classes (possibilities/feature characteristics) within the other feature (small RNA in my case). If there is no way to subclassify the feature, the it belongs to one state only. Now one feature is picked from one state (original data) and put into that state (in my boot data) and this way state-wise features are maintained. Further, after putting each feature into the respective state, every time the background feature (methylation) will be used to find the overlap. I will be using this overlap of two features (seen in boot data) and compare my experimental data with this to test my hypothesis.

ADD REPLY
0
Entering edit mode

Nullranges leaves one feature in the background and segments the genome into ‘states’ as per the classes (possibilities/feature characteristics) within the other feature (small RNA in my case).

I would say, in bootRanges, we leave one feature in its original position, let's call that x. For the other feature y, we move it around to new locations. Segmentation seg defines what can move where, but it seems like this is complicating your analysis here. If you don't specify seg at all, it will move the features to all positions in the genome, by sampling blocks of the original features. I would recommend to try without specifying seg or exclude -- this may help simplify your analysis.

As an example of how we think of the use of seg, in the paper we bootstrap DHS peaks. We segmented the genome to >1Mb segments based on gene density (but you can use any large scale segmentation you like). We provide a segmentation for hg38 and you can easily use our functions to segment any genome based on density of genes etc. What this does is, features in one state will only move to other segments of the same state. DHS in gene rich regions can then only be placed in other gene rich regions.

ADD REPLY
0
Entering edit mode

Thank you again. I will do it without seg and exclude.

I need help in one more point please..

After I am done with my original (experimental) data (calculating overlap of two features) and then done with my bootranges data (finding overlap of two features) across all data sets Am I going to use my original data (overlaps) against the null data generated by bootranges for hypothesis testing? An Answer to this will help me in statistical comparison after generating bootranges data.

ADD REPLY
0
Entering edit mode

We have some example code in the vignette for doing this. This part is highly customizable.

Essentially we recommend this paradigm:

x %>% mutate(num_overlaps = count_overlaps(., original_y))
sum( x$num_overlaps ) # one type of statistic, sum of overlaps

compared to:

x %>% 
  join_overlap_inner(boots) %>%
  group_by(x_id, iter) %>%
  summarize(n_overlaps = n()) %>%
  as.data.frame() %>%
  complete(x_id, iter, fill=list(n_overlaps = 0)) %>%
  group_by(iter) %>%
  summarize(sumOverlaps = sum(n_overlaps))

See vignette for this example. You have to label the ranges in x with a factor:

x <- x %>% mutate(x_id = factor(seq_along(.)))

https://nullranges.github.io/nullranges/articles/bootRanges.html#statistic-i-the-total-number-of-overlaps

ADD REPLY
0
Entering edit mode

Thank you Dr. Michael for all your help. Your elaborative responses has helped me in understanding the concept.

ADD REPLY
0
Entering edit mode

Hello Michael,

I am continuing here and need your expert answer on this again

I have performed small rna loci and DNA methylation mapping for my experimental small rna loci data and bootranges null data. I observed that mean no. of overlaps for experimental small rna data are higher than the null data overlaps (1000 bootstraps). I carried out this overlapping in reverse also that is methylation overlaps with small RNA loci and observed the same. I performed than the z test for comparison of means no. of overlaps and observed positive association with significant p value.

What does this mean? Is it that simple what i am understanding ? or I am missing something in the analysis. Kindly suggest.

ADD REPLY
0
Entering edit mode

It sounds like you have more overlaps than by chance, is that what you would like to see?

ADD REPLY
0
Entering edit mode

Yes. I considered genome wide p value as cutoff.

ADD REPLY
0
Entering edit mode

Looks good then.

ADD REPLY
0
Entering edit mode
Poonam • 0
@e9336529
Last seen 9 hours ago
India

Hi Michael,

I think there is something wrong with the generation of nullranges. I was working with small RNA and methylation overlaps. I generated small RNA loci from my experimental small RNA data and generated null data using bootranges function. I overlapped experimental small RNA loci with methylation and null bootranges with methylation. I compared the mean number of overlaps using the Z test and found always higher and significant number of overlaps in my experimental data when compared to null data. Still I am questioning this, is it true?

Therefore, I generated small RNA loci from females. I am working with males, so the female is an unrelated sample here, there should be no association if my above association is true. I generated everything in females as I generated for males and the outcome is the same (z score positive and highly significant) as seen with males.

My interpretation is that there is something wrong with picking null ranges. If the nullranges generated are fine, then there should be no association. It is also possible that something is wrong with my stats.

I am pasting down the values here:

In the case of females, mean number of sRNA overlapping methylation is 1.26±0.889, n=10708 the mean number of boot1 overlapping methylation is 0.99±0.919, n=10891

In the case of males, the mean number of sRNA overlapping methylation is 1.23±0.904 n=6003 mean number of boot1 overlapping methylation is 1.01±0.930, n=6087

I need your expert advice on this.

ADD COMMENT
0
Entering edit mode

The segmentation and block length are key parameters. We recommend for example blocks of length ~500kb.

It would help if you would post your code.

ADD REPLY
0
Entering edit mode

I tried different block lengths first and considered 100000 to be ideal because of the almost similar inter-range distance.

S1= bootRanges(female_locus2, blockLength=1000, R=3, type="bootstrap", withinChrom=FALSE) S2= bootRanges(female_locus2, blockLength=10000, R=3, type="bootstrap", withinChrom=FALSE) S3= bootRanges(female_locus2, blockLength=100000, R=3, type="bootstrap", withinChrom=FALSE) S4= bootRanges(female_locus2, blockLength=1000000, R=3, type="bootstrap", withinChrom=FALSE)

Output were:

  1. with 1000 block length # A tibble: 4 × 2 iter n <fct> <int> 1 0 10708 2 1 14931 3 2 14917 4 3 14832
  1. 10000 block length # A tibble: 4 × 2 iter n <fct> <int> 1 0 10708 2 1 11127 3 2 11196 4 3 11032

  2. 100000 block length # A tibble: 4 × 2 iter n <fct> <int> 1 0 10708 2 1 10786 3 2 10574 4 3 10807

  3. 1000000 block length # A tibble: 4 × 2 iter n <fct> <int> 1 0 10708 2 1 10659 3 2 10896 4 3 11015

ADD REPLY
0
Entering edit mode

Check the number of bootstrapped data per chromosome compared to the original, and then you can also look at its distribution. For this it's fine to just use one bootstrap iteration (R=1)

You can look at its distribution with a package such as GenomicDistributions:

https://www.bioconductor.org/packages/release/bioc/vignettes/GenomicDistributions/inst/doc/intro.html#chromosome-distribution-plots

If it doesn't look similar to the original, this would motivate using a genome segmentation.

ADD REPLY
0
Entering edit mode

I looked into the genomic distributions. Please see the screenshot attatched  distrubution for female loci, boot1 and boot2

how do we decide that out of two datasets, for which ll we be generating null ranges?

ADD REPLY
0
Entering edit mode

The left plot indicates you should use genome segmentation. It is what is called "nonstationary" meaning it looks like there are distinct regions of higher or lower density. See the vignette for how to use a genome segmentation. We have pre-built segmentations for hg38.

ADD REPLY
0
Entering edit mode

I am working with mouse data. I don't know how to do this, but I will go through it. Can you help me with the second question?

how do we decide that out of two datasets, for which ll we be generating null ranges?

ADD REPLY
0
Entering edit mode

Oh I see, for the second question, I don't have a great answer. I typically think of one set as the anchor, whose ascertainment is driving the question. E.g. GWAS loci, or DE genes. But I don't know if there is a more principled way.

A very quick segmentation would be:

Bin the genome into megabases, count the number of features per megabase, and then define segment 1 to be megabases less than the median and segment 2 to be megabases greater than the median.

You could then use blocks of size ~200kb.

The effect would be to shuffle 200kb windows around, but you would preserve the high level genomic density.

How large are your features again? And what maxgap are you allowing?

ADD REPLY
0
Entering edit mode

I will follow what you suggested.

I didn't use max gap anywhere. I was following statistic I and regarding the size of features, my small RNA loci median length is 235nt.

I will also generate null ranges for methylation data, then I will see what relation comes? Any suggestions for methylation data segmentation? I am working with a particular embryonic stage where genome is not completely methylated yet and only 21-25% CpGs are methylated.

ADD REPLY
0
Entering edit mode

Any suggestions for methylation data segmentation?

I think the same segmentation can be used.

ADD REPLY
0
Entering edit mode

Hi Michael,

I have tried what you suggested. I started with methylation loci. I created segment1 and segment2 but how to combine them because in the bootRanges function I have to define seg. Please see the code below. I don't know whether it is right or not. Please guide.

# Load necessary libraries
library(BSgenome.Mmusculus.UCSC.mm10)  # Mouse genome
library(GenomicRanges)  # GRanges
library(dplyr)  # Data manipulation
library(nullranges)

# Load the mouse genome
genome <- BSgenome.Mmusculus.UCSC.mm10
seq_lengths <- seqlengths(genome)

# Load feature data
# Ensure your data has 'seqnames', 'start', 'width', and other required attributes
methyldata2 <- read.csv("meth_locus_again.csv", header = TRUE)

# Create GRanges object
methyldata2=read.csv("meth_locus_again.csv", header=TRUE)
attach(methyldata2)
seqnames_m2 <- c(methyldata2$seqnames)
methylation_loci <- GRanges(seqnames=seqnames_m2,
                            IRanges(start=c(methyldata2$start),
                                    width=c(methyldata2$width )),
                            seqlengths=c(chr1=195471971,chr2=182113224,chr3=160039680,chr4=156508116,chr5=151834684,chr6=149736546,chr7=145441459,chr8=129401213,chr9=124595110,chr10=130694993,chr11=122082543,chr12=120129022,chr13=120421639,chr14=124902244,chr15=104043685,chr16=98207768,chr17=94987271,chr18=90702639,chr19=61431566,chrX=171031299),
                            chr=factor(seqnames_m2))
values(methylation_loci)=DataFrame(x_id=c(methyldata2$x_id))
print(methylation_loci)

# Define bin size in base pairs (1 megabase)
bin_size <- 1e6

# Create data frame with bins
bin_data <- data.frame(
  chr = seqnames(methylation_loci),
  start = start(methylation_loci),
  bin_index = floor(start(methylation_loci) / bin_size) + 1
)

# Count the number of features per bin
bin_counts <- bin_data %>%
  group_by(chr, bin_index) %>%
  summarise(count = n())

print(bin_counts)

# Get median count of features per bin
median_count <- median(bin_counts$count)

# Define segments based on the median
segment1 <- bin_counts %>%
  filter(count < median_count)

segment2 <- bin_counts %>%
  filter(count >= median_count)

create_granges <- function(segment) {
  GRanges(
    seqnames = segment$chr,
    ranges = IRanges(
      start = (segment$bin_index - 1) * bin_size + 1,
      width = bin_size
    )
  )
}

segment1_granges <- create_granges(segment1)
segment2_granges <- create_granges(segment2)

mcols(segment1_granges)$state <- "1" 
mcols(segment2_granges)$state <- "2" 

print(segment1_granges)
print(segment2_granges)

seg_list <- list(segment1 = segment1_granges, segment2 = segment2_granges)
print(seg_list)


boot_results <- bootRanges(methylation_loci,
  blockLength = 200000,
  R = 1,
  seg = seg_list
)

print(boot_results)
write.csv(boot_results, "boot1.csv")
ADD REPLY
0
Entering edit mode

I'll take a look later.

For next time, I've edited your post by enclosing the code in triple backticks (on their own link). This properly formats the code.

ADD REPLY
0
Entering edit mode

Segmentation is of the whole genome, I'll write some code for doing this later today.

ADD REPLY
0
Entering edit mode

That ll be helpful. Thank you.

ADD REPLY
0
Entering edit mode
ADD REPLY

Login before adding your answer.

Traffic: 503 users visited in the last hour
Help About
FAQ
Access RSS
API
Stats

Use of this site constitutes acceptance of our User Agreement and Privacy Policy.

Powered by the version 2.3.6