Hello,
I am have ChIPseq data from histone marks from 2 different condition (mock and treated with 2 biological replicas each) and the aim of my analysis is to study whether a particular histone mark is enriched in one condition versus the other. I am new to bioinformatic and I don't have any statistical training and I am trying to teach myself how to normalise the data and perform the differential peak analysis. From my understanding, without prior knowledge and/or assumptions on biases/expected results, the best way to normalise my data is using background=TRUE and normalize=DBA_NORM_NATIVE. Established that, I am having trouble understanding with type of analysis method is best to use in my case. After normalisation, I set the contrast:
WTtest_model <- dba.contrast(WTtest_norm, reorderMeta=list(Condition="WT_mock"), minMembers = 2)
WTtest_model
Samples, 36975 sites in matrix:

     ID  Factor  Condition Replicate    Reads FRiP
Sample6 H3K4me3   WT_mock         1 14524870 0.50
Sample11 H3K4me3    WT_mock         2 15263769 0.44
Sample17 H3K4me3 WT_treated         1 14206596 0.40
Sample22 H3K4me3 WT_treated         2 15396209 0.40
I then do the differential peak analysis:
WTtest_res <- dba.analyze(WTtest_model, method=DBA_ALL_METHODS)
dba.show(WTtest_res,bContrasts=TRUE)
 Factor      Group Samples  Group2 Samples2 DB.edgeR DB.DESeq2
1 Condition WT_treated       2 WT_mock        2     9690       144
The results shows a big difference between the amount of differential bound regions identified with edgeR or DEseq2(with 98% less peaks identified by DEseq2 in respect to edgeR). What is the reason behind such difference? Which analysis method would best suit my type of study/data and why?
Second question, in the example I have used the data from H3K4me3 ChIPseq experiment. With other histone mark generating broader peaks (like H3K9me2 or H3K27ac) should I change anything in the script?
Any help is greatly appreciated as I cannot really get my head around this.


Hi Rory,
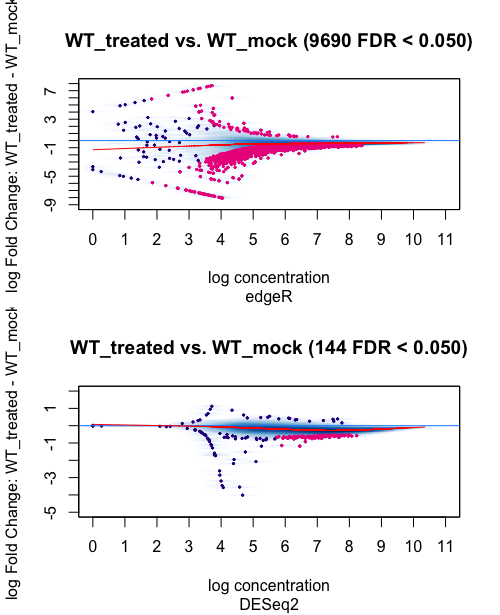
Thank you for your quick reply and advice on the matter. The following are the MAplots for the analysis using the background=TRUE and normalize=DBA_NORM_NATIVE parameters.
While using the full library normalisation I get this result:
And the following MAplots are:
For edgeR the distribution of the peaks in the plot do not seem to change much even though the difference in differential peaks called in bigger that for Deseq2. In the case of DEseq2, I can see that the distribution of the peaks in the plots is a bit more different, especially looking at the peaks in the left "tail". When I compare DEseq2 with EdgeR independently of the normalisation, there is quite a difference. But I would not know how to interpret this result or decide on which method is the best. What is your advice? Thanks a lot for you for your help again.