Entering edit mode

Hi all,
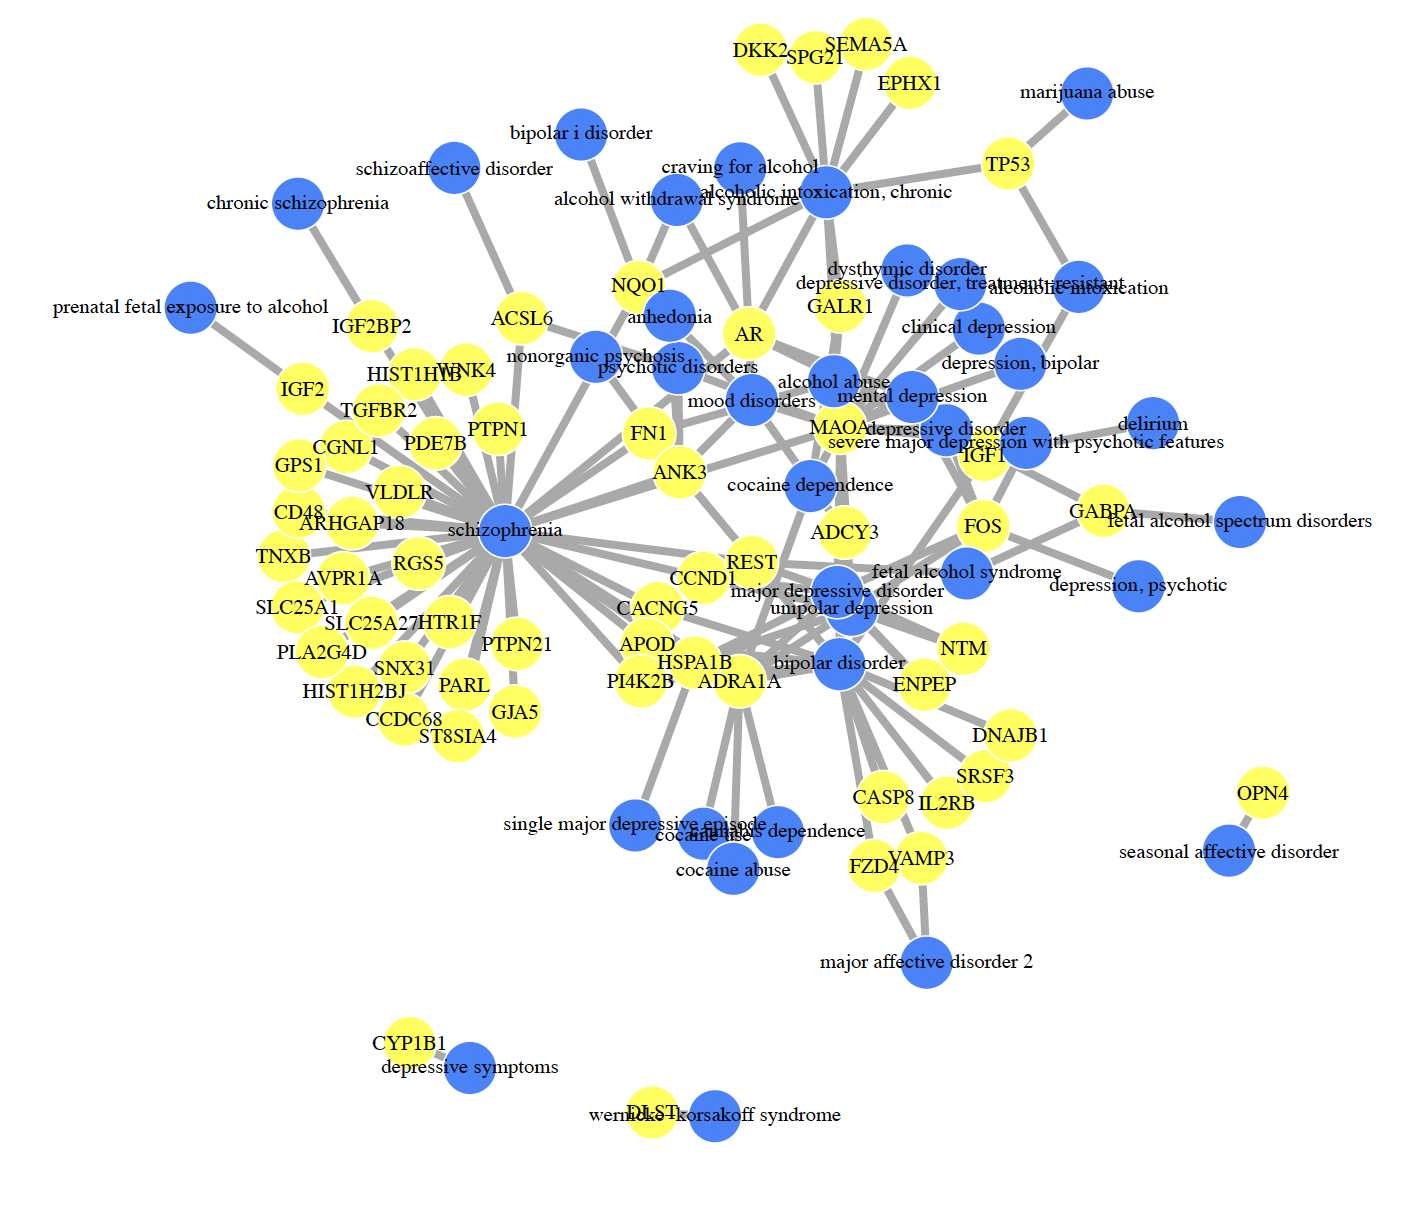
I'm using the psygenet2r package to generate plots as the one attached. Does anyone have any idea how to adjust the spacing around nodes/label position/label sizing/colour of node per disease? I'd like to make this plot a little easier on the eyes.
Thanks in advance!
genesOfInterest <- c() ...... # list of genes removed since it's long

m1 <- psygenetGene(
  gene     = genesOfInterest,
  database = "ALL",
  verbose  = TRUE)

m1
plot( m1 )
It's a base R plot, so you can not modify it post-generation. Running the
psygenetGenedoc example......
class(p)gives meDataGeNET.Psy. So if you check out?'plot,DataGeNET.Psy,ANY-method'('should be back-ticks, but I can't get this working here...) you'll find some options to control plotting aesthetics.