Hi, I've used DiffBind to analyze differential binding analysis for cut&tag data.
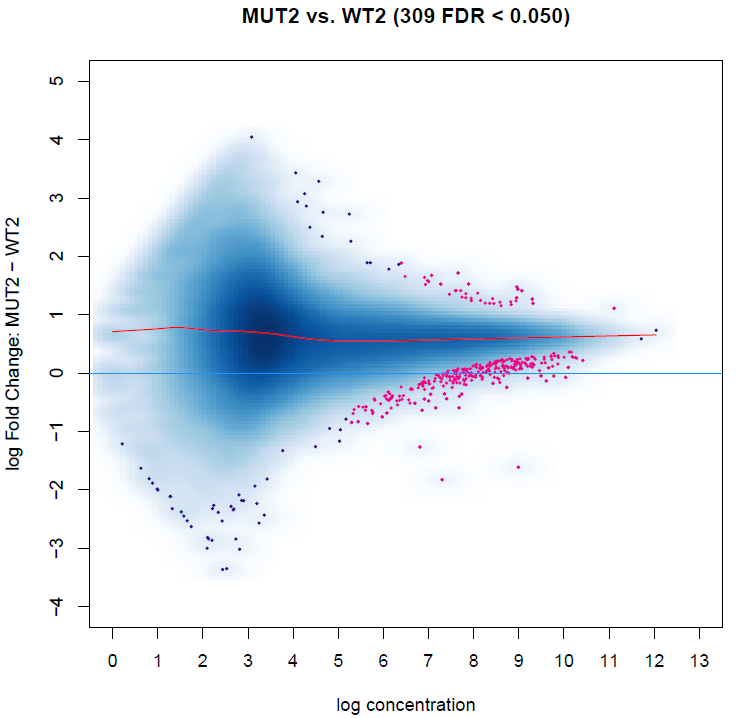
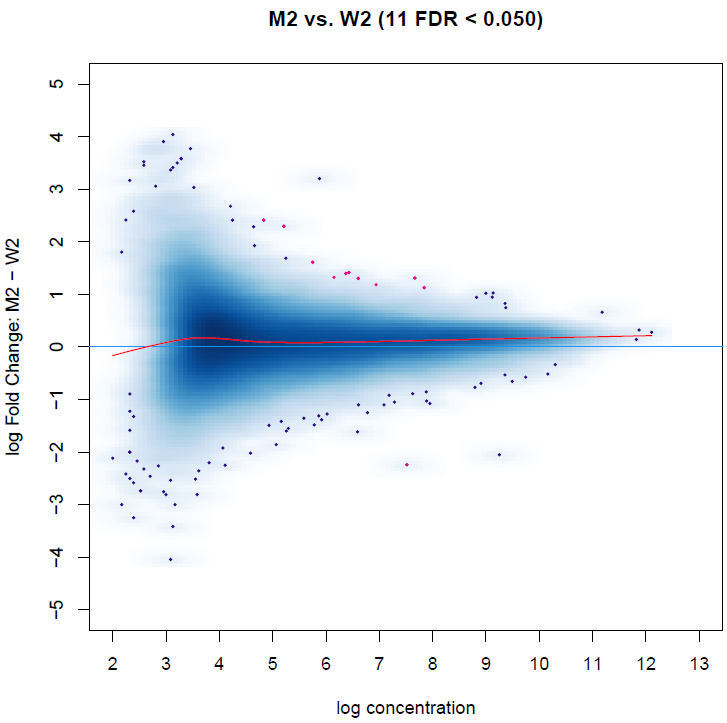
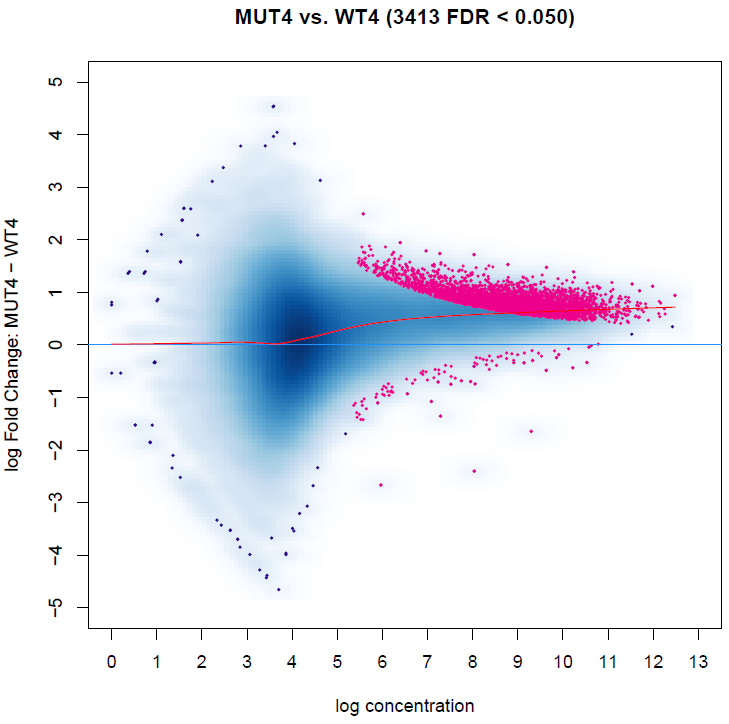
The result is showed in MAplot:
I noticed some peaks with 0 log fold change are differentially biding sites, while it could be a little bit confusing.
I see this result should be caused by the overall gaining of binding affinity, as the red curve indicates.
However, this data is spike-in normalized, and the overall gaining of binding affinity might be reasonable in our case.
So how can I get differential binding sites without considering the overall gaining of signal?
I can manually set a cutoff (e.g. abs(log FC) > 1) to determine, however the p-value and FDR should be re-caculated, which I don't know how to do in DiffBind.
Here is my code, just regular steps but with a spike-in normalization:
sample = read.csv("samplesheet.csv")
CTCF <- dba(sampleSheet=sample)
CTCF <- dba.count(CTCF)
scale_factors = read.delim("scale_factors.txt", header=T, row.names=1)
CTCF <- dba.normalize(CTCF, normalize=scale_factors$scale_factor)
MUT2_vs_WT2 <- dba.contrast(CTCF, design=FALSE, group1 = CTCF$masks$M2, group2 = CTCF$masks$W2, name1 = "MUT2", name2 = "WT2",  minMembers = 2)
MUT2_vs_WT2 <- dba.analyze(MUT2_vs_WT2)
Thanks for your kindly help in advance!


Rory Stark Could you please help take a look? Really appreciate it!