Hello,
I am performing RNA-Seq Analysis on 6 samples: 3 from an infected group and 3 from control. I have performed alignment and quantification and removed ribosomal-RNA reads.
I use Edge-R to filter and the TMM-normalize my read counts. I typically remove all genes not expressed over 1 CPM in atleast 2 samples (smallest group - 1), as shown below. This filtering decreases my genes from 63k to 18k.
# Function to remove features not expressed over 1 CPM in at least 2 samples
keep <- rowSums(cpm(d)>1) >=2
d <- d[keep,]
d <- calcNormFactors(d, method = "TMM")
I then perform the following in order to isolate DEGs using Limma:
design <- model.matrix(~d$samples$group) #model by infected vs control groups

# Calculate Weighted Likelihoods, prepare to be linearly modeled
v <- voomWithQualityWeights(d, design, plot = TRUE)

# fit linear model
vfit <- lmFit(v, design)
# Empirical Bayes Transform
vfit <- eBayes(vfit)
plotSA(vfit)
# Variance no longer dependent on mean

# Check # of up + down regulated genes
dt <- decideTests(vfit)
summary(dt)

# TOP Differential expressed GENES
topTable(vfit, coef=2, sort.by = "P")
top <- topTable(vfit,coef=2,number=Inf,sort.by="P", adjust.method = "fdr")
sum(top$adj.P.Val<0.05)

conversions <- read.csv("./ENSG_symbol_conversions.csv")
top_gene_table <- left_join(tibble::rownames_to_column(top), conversions, by=c("rowname" = "ensembl_gene_id_version"))
head(top_gene_table, 40)
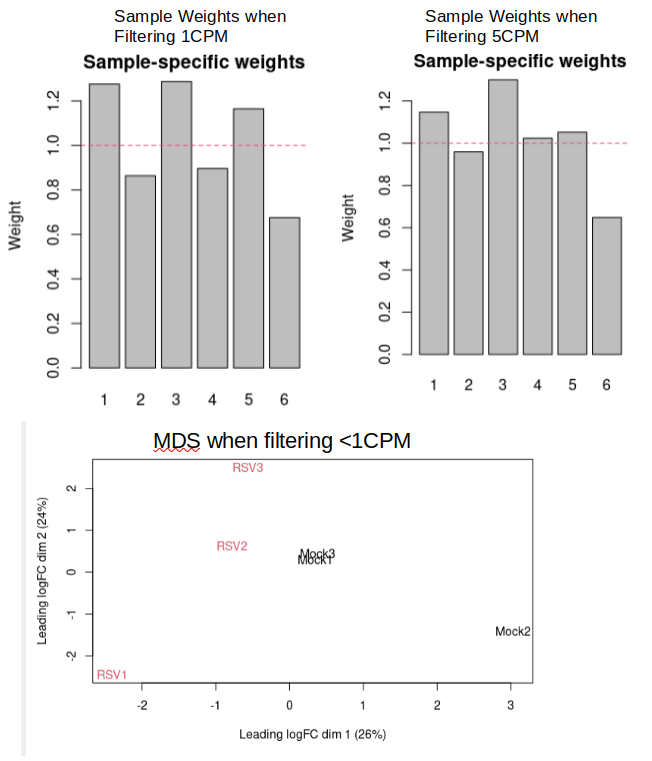
The issue is that I get no significant FDR adjusted p-values. However, I have 80+ significant p-values (although I know this can contain many false-positives). There is a lot of variation between my samples as can be seen in the image below:
However, When I change my filtering criteria to filter out genes not expressed over 5 CPM in at-least two samples (12.5k genes remaining), I get 13 Significant FDR adjusted p-values and the sample weights are shown above on the right and a slight decrease in variation is seen between some samples. Is there any reason that this extended filtering should be avoided?
Thanks, Sara


Hi Gordon Smyth ,
I was following direction from our local sequencing-center's pipeline. Even using basic filterbyExpr() and adding "robust=T" to ebayes() does not result in any significant DEGs on the FDR-adjusted p-value level.
The only thing that results in significant DEGs is further filtration of genes expressed over 5 CPM. So, this is more extensive filtration than I have seen in suggested tutorials, so are there any consequences to be concerned of when using deep filtration? I would not think so but I am a new bioinformatician and always like to hear from those more experienced.
As I said, it is fine to filter more deeply. The only real consequence is that you keep fewer genes and therefore lose the possibility of detecting DE at lower expression levels.