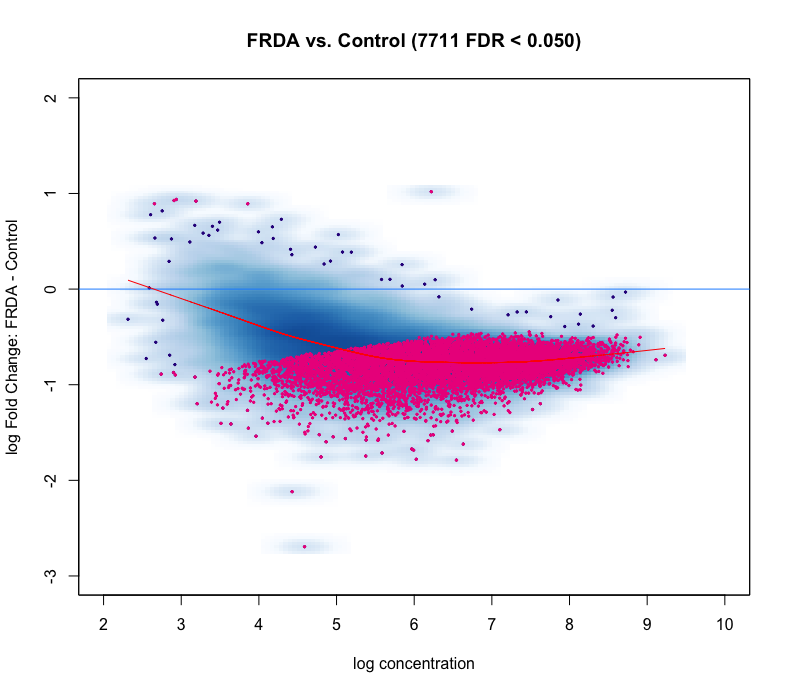
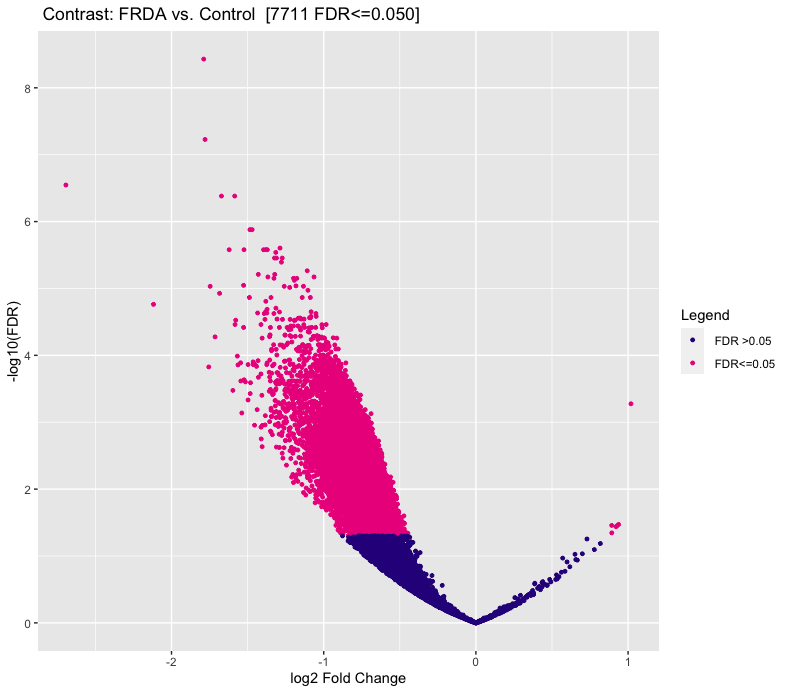
I'm using DiffBind for ATAC-seq DA analysis. The MA plot and volcano look nothing like I expect. I do not expect a large difference between my experimental (FRDA) and control group. But as you can see in the figures, below, there is a heavy skew for regions down regulated compared to control.

I tried loess curve offset normalization, since the curve doesn't look centered at all
counts_NP.loess <- dba.normalize(counts_NP, method = DBA_ALL_METHODS ,offsets = TRUE).
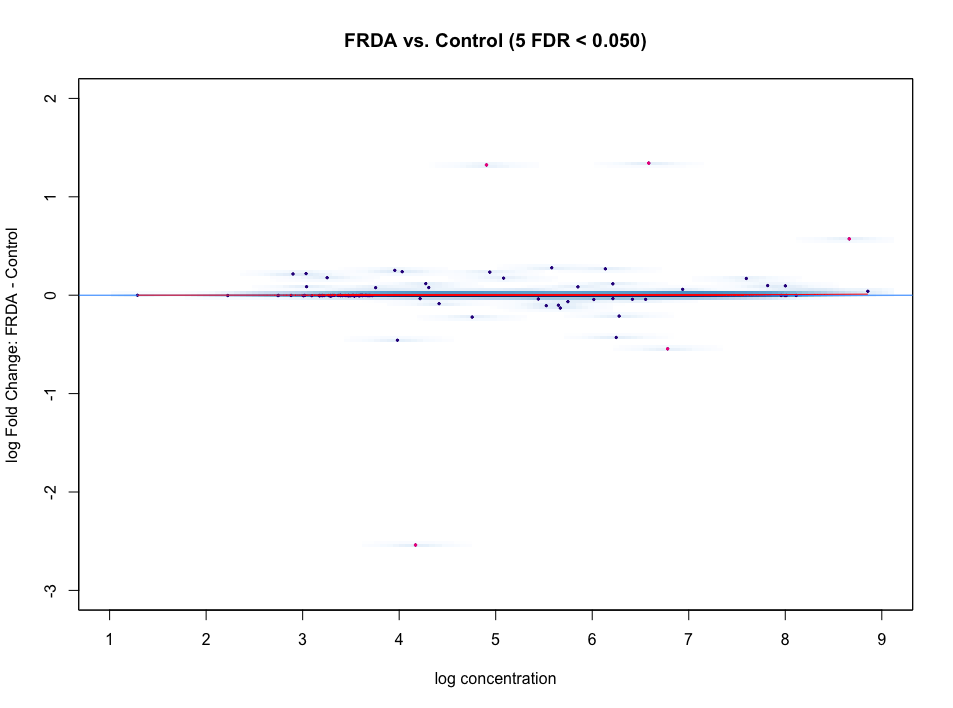
After adjusting the offset, the plots look even worse!
I'm fairly new to both ATAC and DiffBind, so any help and tips would be greatly appreciated!
> sessionInfo()
R version 4.2.1 (2022-06-23)
Platform: x86_64-apple-darwin17.0 (64-bit)
Running under: macOS Ventura 13.4

Matrix products: default
LAPACK: /Library/Frameworks/R.framework/Versions/4.2/Resources/lib/libRlapack.dylib

locale:
[1] en_US.UTF-8/en_US.UTF-8/en_US.UTF-8/C/en_US.UTF-8/en_US.UTF-8

attached base packages:
[1] stats4    stats     graphics  grDevices utils     datasets  methods   base

other attached packages:
 [1] csaw_1.30.1                 GreyListChIP_1.28.1         DiffBind_3.6.5              SummarizedExperiment_1.28.0
 [5] Biobase_2.58.0              MatrixGenerics_1.10.0       matrixStats_0.63.0          GenomicRanges_1.50.1
 [9] GenomeInfoDb_1.34.4         IRanges_2.32.0              S4Vectors_0.36.1            BiocGenerics_0.44.0

loaded via a namespace (and not attached):
  [1] utf8_1.2.3               spatstat.explore_3.2-1   reticulate_1.28          tidyselect_1.2.0
  [5] RSQLite_2.3.1            AnnotationDbi_1.60.0     htmlwidgets_1.6.2        grid_4.2.1
  [9] BiocParallel_1.32.4      Rtsne_0.16               munsell_0.5.0            codetools_0.2-19
 [13] ica_1.0-3                interp_1.1-4             systemPipeR_2.2.2        future_1.32.0
 [17] miniUI_0.1.1.1           withr_2.5.0              spatstat.random_3.1-5    colorspace_2.1-0
 [21] progressr_0.13.0         knitr_1.43               rstudioapi_0.14          Seurat_4.3.0
 [25] ROCR_1.0-11              tensor_1.5               listenv_0.9.0            labeling_0.4.2
 [29] bbmle_1.0.25             GenomeInfoDbData_1.2.9   mixsqp_0.3-48            hwriter_1.3.2.1
 [33] polyclip_1.10-4          farver_2.1.1             bit64_4.0.5              coda_0.19-4
 [37] parallelly_1.36.0        vctrs_0.6.2              generics_0.1.3           xfun_0.39
 [41] R6_2.5.1                 apeglm_1.18.0            invgamma_1.1             locfit_1.5-9.7
 [45] cachem_1.0.8             bitops_1.0-7             spatstat.utils_3.0-3     DelayedArray_0.24.0
 [49] promises_1.2.0.1         BiocIO_1.8.0             scales_1.2.1             gtable_0.3.3
 [53] globals_0.16.2           goftest_1.2-3            rlang_1.1.1              splines_4.2.1
 [57] rtracklayer_1.58.0       lazyeval_0.2.2           spatstat.geom_3.2-1      yaml_2.3.7
 [61] reshape2_1.4.4           abind_1.4-5              httpuv_1.6.11            tools_4.2.1
 [65] ggplot2_3.4.2            ellipsis_0.3.2           gplots_3.1.3             RColorBrewer_1.1-3
 [69] ggridges_0.5.4           Rcpp_1.0.10              plyr_1.8.8               zlibbioc_1.44.0
 [73] purrr_1.0.1              RCurl_1.98-1.12          deldir_1.0-9             pbapply_1.7-0
 [77] ashr_2.2-54              cowplot_1.1.1            zoo_1.8-12               SeuratObject_4.1.3
 [81] ggrepel_0.9.3            cluster_2.1.4            magrittr_2.0.3           data.table_1.14.8
 [85] scattermore_1.1          lmtest_0.9-40            RANN_2.6.1               truncnorm_1.0-9
 [89] mvtnorm_1.1-3            SQUAREM_2021.1           amap_0.8-19              fitdistrplus_1.1-11
 [93] patchwork_1.1.2          mime_0.12                evaluate_0.21            xtable_1.8-4
 [97] XML_3.99-0.14            emdbook_1.3.12           jpeg_0.1-10              gridExtra_2.3
[101] compiler_4.2.1           bdsmatrix_1.3-6          tibble_3.2.1             KernSmooth_2.23-21
[105] crayon_1.5.2             htmltools_0.5.5          later_1.3.1              geneplotter_1.76.0
[109] tidyr_1.3.0              DBI_1.1.3                MASS_7.3-60              ShortRead_1.54.0
[113] Matrix_1.5-4.1           cli_3.6.1                parallel_4.2.1           metapod_1.4.0
[117] igraph_1.4.3             pkgconfig_2.0.3          GenomicAlignments_1.34.0 numDeriv_2016.8-1.1
[121] sp_1.6-0                 plotly_4.10.1            spatstat.sparse_3.0-1    annotate_1.76.0
[125] XVector_0.38.0           stringr_1.5.0            digest_0.6.31            sctransform_0.3.5
[129] RcppAnnoy_0.0.20         spatstat.data_3.0-1      Biostrings_2.66.0        rmarkdown_2.21
[133] leiden_0.4.3             uwot_0.1.14              edgeR_3.38.4             restfulr_0.0.15
[137] shiny_1.7.4              Rsamtools_2.14.0         gtools_3.9.4             rjson_0.2.21
[141] lifecycle_1.0.3          nlme_3.1-162             jsonlite_1.8.4           viridisLite_0.4.2
[145] limma_3.52.4             BSgenome_1.66.1          fansi_1.0.4              pillar_1.9.0
[149] lattice_0.21-8           KEGGREST_1.38.0          fastmap_1.1.1            httr_1.4.6
[153] survival_3.5-5           glue_1.6.2               png_0.1-8                bit_4.0.5
[157] stringi_1.7.12           blob_1.2.4               DESeq2_1.38.1            memoise_2.0.1
[161] latticeExtra_0.6-30      caTools_1.18.2           dplyr_1.1.2              irlba_2.3.5.1
[165] future.apply_1.11.0


