
Good morning,
I am currently trying to analyse a small-RNA sequencing dataset using limma package and the voomLmFit function. However, I am experiencing some issues with the p-value distribution, with some of the comparisons I am testing showing odd p-value distribution. This probably indicates that there is some kind of batch effect that I am not correcting for, even though there is no separation of the samples in the PCA plot based on any of the potential confounding variables.
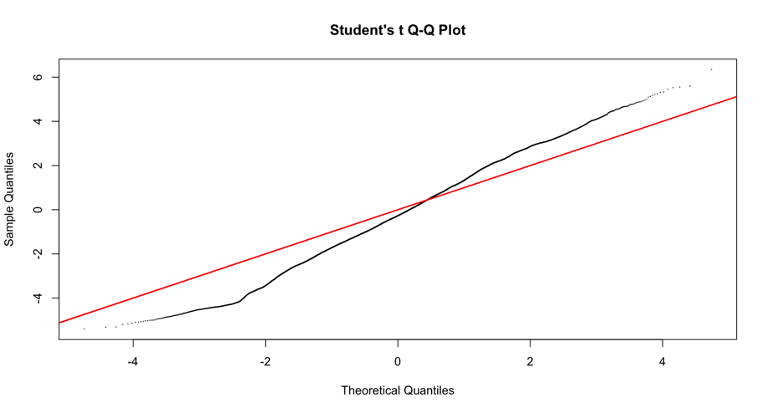
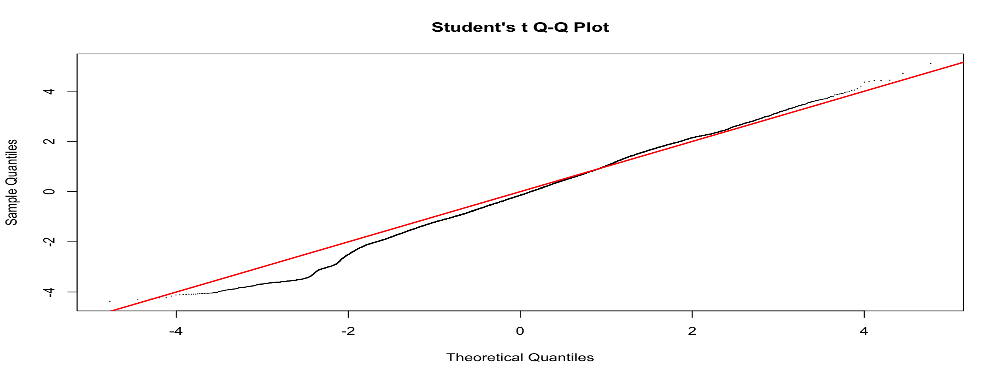
I have tried to include different variables in the model to see if the p-value distribution improves, but it does not. However, including some variables (for examples RNA_extraction_batch) improves the Students t Q-Q plot (that I read it is good to check?). Do you have any suggestion on why this is the case and if I should use a model that improves the Q-Q plot even though it does not really improve the p-value distribution? I have included the code and two examples of qq plots of the fit2$t with or without including the variables in the model.
Thank you for the help!
y <- DGEList(counts = counts[, -c(1:6)], samples = metadata, genes = counts[, 1:6])
design <- model.matrix(~0 + group +V1 +V2, data = y$samples) #V1 and V2 are optional

keep <- filterByExpr(y,  min.count = 10, design = design)

y <- y[keep,,keep.lib.sizes = FALSE]

y <- calcNormFactors(y)

v <- voomLmFit(counts = y, design = design, sample.weights = TRUE, plot= TRUE)

fit <- eBayes(v)

contrasts <- makeContrasts(....) #all the different contrasts that I want to test

fit2 <- contrasts.fit(fit, contrasts)

fit2 <- eBayes(fit2)

hist(topTable(fit2, coef = x, number = Inf)$P.Value, breaks = 20) #x = specific contrast

#qqplot

qqt(fit2$t, df=fit2$df.prior+fit2$df.residual,pch=16,cex=0.2)

abline(0,1, col="red", lwd=2)

Ok, thanks a lot for your insight!