This post is in response to a number of emails and posts asking about reading data into edgeR and producing RPKM.
Reading a data file containing both counts and annotation
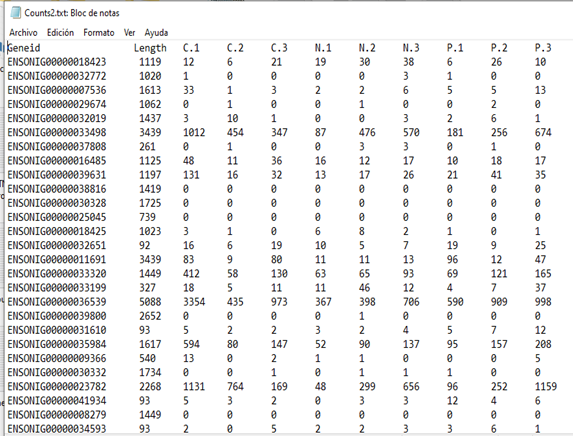
Suppose we start with a tab-delimited file counts.txt like this:
The file contains counts but also gene IDs and an annotation column. To read this into edgeR:
library(edgeR)
Data <- read.delim("counts.txt", sep="\t", row.names=1)
y <- DGEList(Data, annotation="Length")
To normalize the library sizes and compute a matrix of RPKM values:
y <- normLibSizes(y)
RPKM <- rpkm(y)
To make a PCA plot of log-RPKM values
logRPKM <- rpkm(y, log=TRUE)
plotMDS(logRPKM, gene.selection="common")
To make an MDS plot from the log-RPKM values
plotMDS(logRPKM, gene.selection="pairwise")
Creating a DGEList from featureCounts
If the count matrix is created using Rsubread::featureCounts then the output can be transformed to a DGEList directly, without any need for intermediate data files:
fc <- featureCounts( ... )
y <- featureCounts2DGEList(fc)
The resulting DGEList object will automatically include annotation columns including chromosome and gene length.


