
Hi, I am a PhD student seeking advice on how I can devise a method like DESeq2 to give statistics for paired multiple -omic datasets that are aligned with those produced on RNA-Seq count data by DESeq2 (one of the multi-omic datasets for paired samples), so that they can be more easily and justifiably compared.
I have tried to see how close a negative binomial glm run on the continuous dispersion-normalized RNA-seq data (simulating continuous LFQ intensities) gets to the DESeq2 results stats table (see below).
#DESeq2 output:
# GeneID   baseMean log2FoldChange     lfcSE     stat           pvalue            padj
# Actr5   193.914597    1.21224548      0.31072676   3.90132314 9.57E-05      0.00074757


thisGene.exp<-c(282.2568792,    278.5787192,    171.4072232, 108.2000439,   136.845039, 73.42960134)

Grouping <- c(1,1,1,2,2,2)

lmdat.l2=data.frame(exp=thisGene.exp,Grouping=Grouping)

#negative binomial generalized model
model <- tryCatch( MASS::glm.nb(exp ~ Grouping, data = lmdat.l2), error= function(e) lm(exp ~ Grouping,data = lmdat.l2) )
SE=sqrt(diag(vcov(model))[2])
LFC=mean(lmdat.l2$exp[which(Grouping==names(table(Grouping))[1])])-mean(lmdat.l2$exp[which(Grouping==names(table(Grouping))[2])])
stat=LFC/SE
lowerTail=if(LFC<0) { TRUE } else { FALSE }
pvalue=pnorm(LFC/SE,lower.tail=lowerTail)*2
if(pvalue>1) pvalue=1

c(Gene=this.gene,baseMean=mean(2^lmdat.l2$exp),LFC=LFC,lfcSE=SE,stat=stat,pvalue=pvalue)
# Gene               baseMean                    LFC         lfcSE.Grouping          stat.Grouping
# "Actr5" "1.66841108419978e+84"     "137.922712453333"    "0.192871498086593"     "715.101577068743"
# pvalue.Grouping
# "0"
Additionally, would you defend an argument that different statistics for the different -omics data makes sense and that the methods for calculating the statistics do not have to be aligned in this way to compare the datasets?
Thank you for your time and consideration.

I sent Christina here to post with the intent of showing for a population of transcriptomic measurements, how the negative binomial glm that underpins DESeq2 handles both the integer counts data and continuous data (normalized counts/size factors) is comparable. Then, anticipating common criticism by naive reviewers of multi-omic analyses, we are hoping to get feedback on the appropriateness of (i.e., the answer to "why not...") using statistics derived from the glm.nb or glm(..., family=negative.binomial(theta)) functions on continuous omic abundance data.
Ignoring the complexity of estimating dispersion (we use DESeq2's estimates), we find that with a few exceptions of outlier genes, the negative binomial glm works to produce highly correlated log2FC and lfcSE estimates for the Wald statistic calculation. Shown below are correlations for our actual RNA Seq count integer data, and the corresponding counts/sizeFactors continuous data used as input.
And the Z statistic calculations using integer vs. continuous quantification correlate, with a minority of transcripts fanning out from y=x: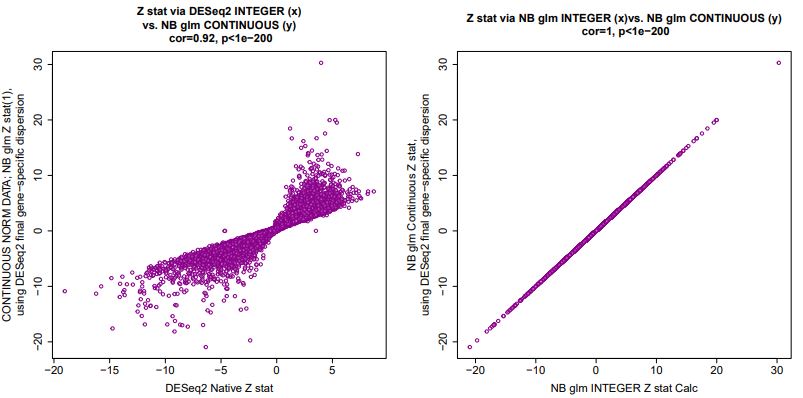
To allow readers a reproducible example, I put together this R code to generate simulated count data with a distribution and dispersions roughly similar to actual 17000 gene RNA-Seq count data that we are working with, which generates PDF graphical outputs (scatter plots) of all comparisons that can be made:
Multi-omic Harmonized Wald Test Pilot R code with Simulated Count Data
Correlations in outputs generated by the above code, in full do not look much worse than those for the real transcriptomic data comparison of continuous to integer count input.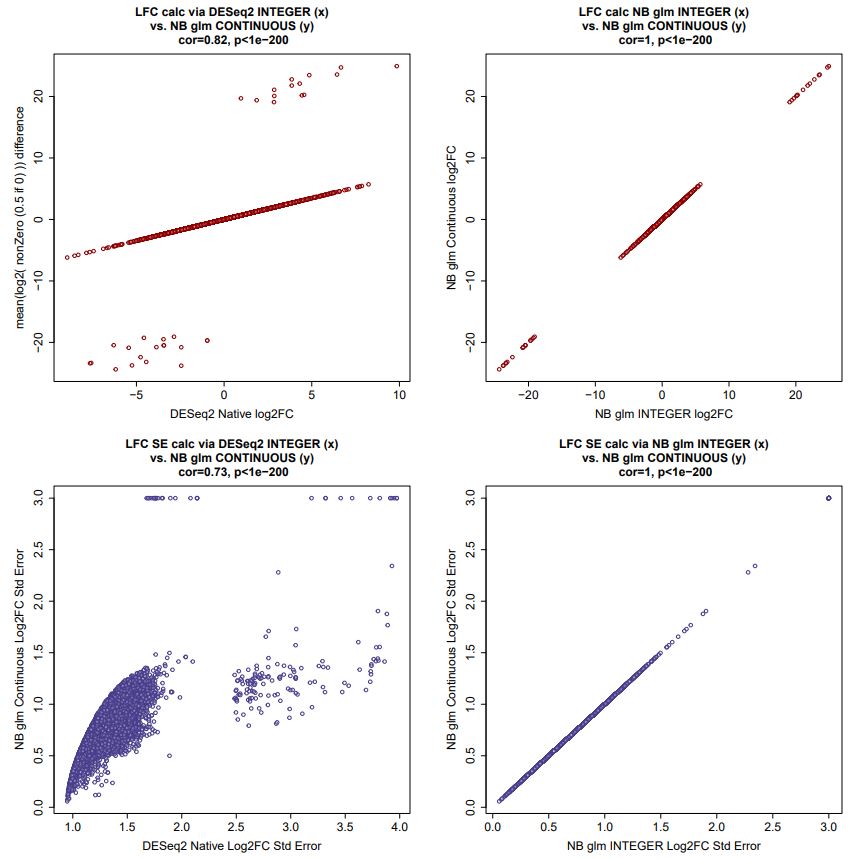
The log2FC calculated using mean of log2(counts) difference across groups is well correlated as a population, especially given we are simulating a comparison of two groups with n=3: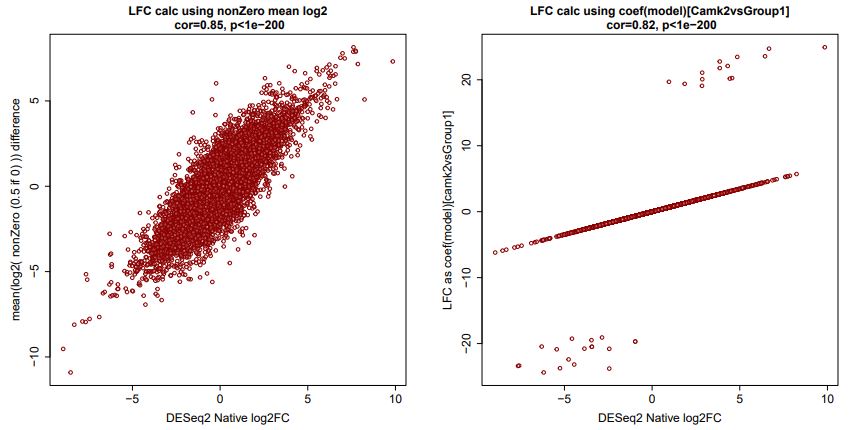
And generally, this alternate calculation ratioed with the negative binomial-derived lfcSE (again) produces correlated Wald Z statistics: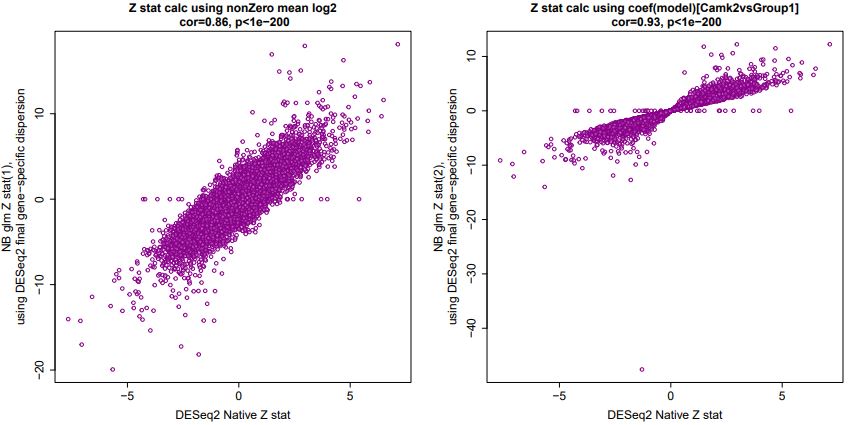
In conclusion, we ask what should we be worried about in adapting and refining the above approach to generate harmonized statistics for both DESeq2 analysis of RNA-Seq counts, and paired proteomic data which as LFQ can have missing values imputed, but is continuous? In other words, why shouldn't we attempt to harmonize statistics for integer counts and continuous paired sample data for different -omics on the same samples?