
Hello everyone,
I am comparing gene expression profiles between 8 different conditions (developmental stages in this case) with a design = ~ condition. I donot specifically have a "control" condition per se to set as a reference so I used the contrast= option when calling results(). I wanted to check whether switching the reference condition, i.e. switching the numerator and denominator terms in contrast=, gives similar results and used the code below to make the comparisons. Note: I did not do the pre-filtering step and only include the relevant lines of code for space reasons.
### I3 as denominator
ddsTxi.tr$condition <- relevel(ddsTxi.tr$condition, "I3")
dds.tr <- DESeq(ddsTxi.tr)
res_contrast_I5_vs_I3 <- results(dds.tr, contrast = c("condition", "I5", "I3")  )
write.csv(as.data.frame(res_contrast_I5_vs_I3), file = "res_contrast_I5_vs_I3_padjOrdered_noleaf.csv")
res_contrast_I5_vs_I3 <- results(dds.tr, contrast = c("condition", "I5", "I3"), lfcThreshold = 1, alpha = 0.05)
summary(res_contrast_I5_vs_I3)
>out of 128220 with nonzero total read count
>adjusted p-value < 0.05
>LFC > 1.00 (up)    : 4285, 3.3%
>LFC < -1.00 (down) : 1118, 0.87%
>outliers [1]       : 793, 0.62%
>low counts [2]     : 24737, 19%
>(mean count < 4)
>[1] see 'cooksCutoff' argument of ?results
>[2] see 'independentFiltering' argument of ?results

### I5 as denominator
ddsTxi.tr$condition <- relevel(ddsTxi.tr$condition, "I5")
dds.tr <- DESeq(ddsTxi.tr)
res_contrast_I3_vs_I5 <- results(dds.tr, contrast = c("condition", "I3", "I5")  )
write.csv(as.data.frame(res_contrast_I3_vs_I5), file = "res_contrast_I3_vs_I5_padjOrdered_noleaf.csv")
res_contrast_I3_vs_I5 <- results(dds.tr, contrast = c("condition", "I3", "I5"), lfcThreshold = 1, alpha = 0.05)
summary(res_contrast_I3_vs_I5)
>out of 128220 with nonzero total read count
>adjusted p-value < 0.05
>LFC > 1.00 (up)    : 1169, 0.91%
>LFC < -1.00 (down) : 4229, 3.3%
>outliers [1]       : 793, 0.62%
>low counts [2]     : 24737, 19%
>(mean count < 4)
>[1] see 'cooksCutoff' argument of ?results
>[2] see 'independentFiltering' argument of ?results
As you can see the results are not exactly the same. I was wondering why this happens and searched for relevant posts in the discussion forums but did not find any posts which gave a definite answer.
I extracted the gene Ids from both results to compare the overlap and there are DEGs exclusively being reported when one or the other condition is used as denominator (shown in venn diagram).
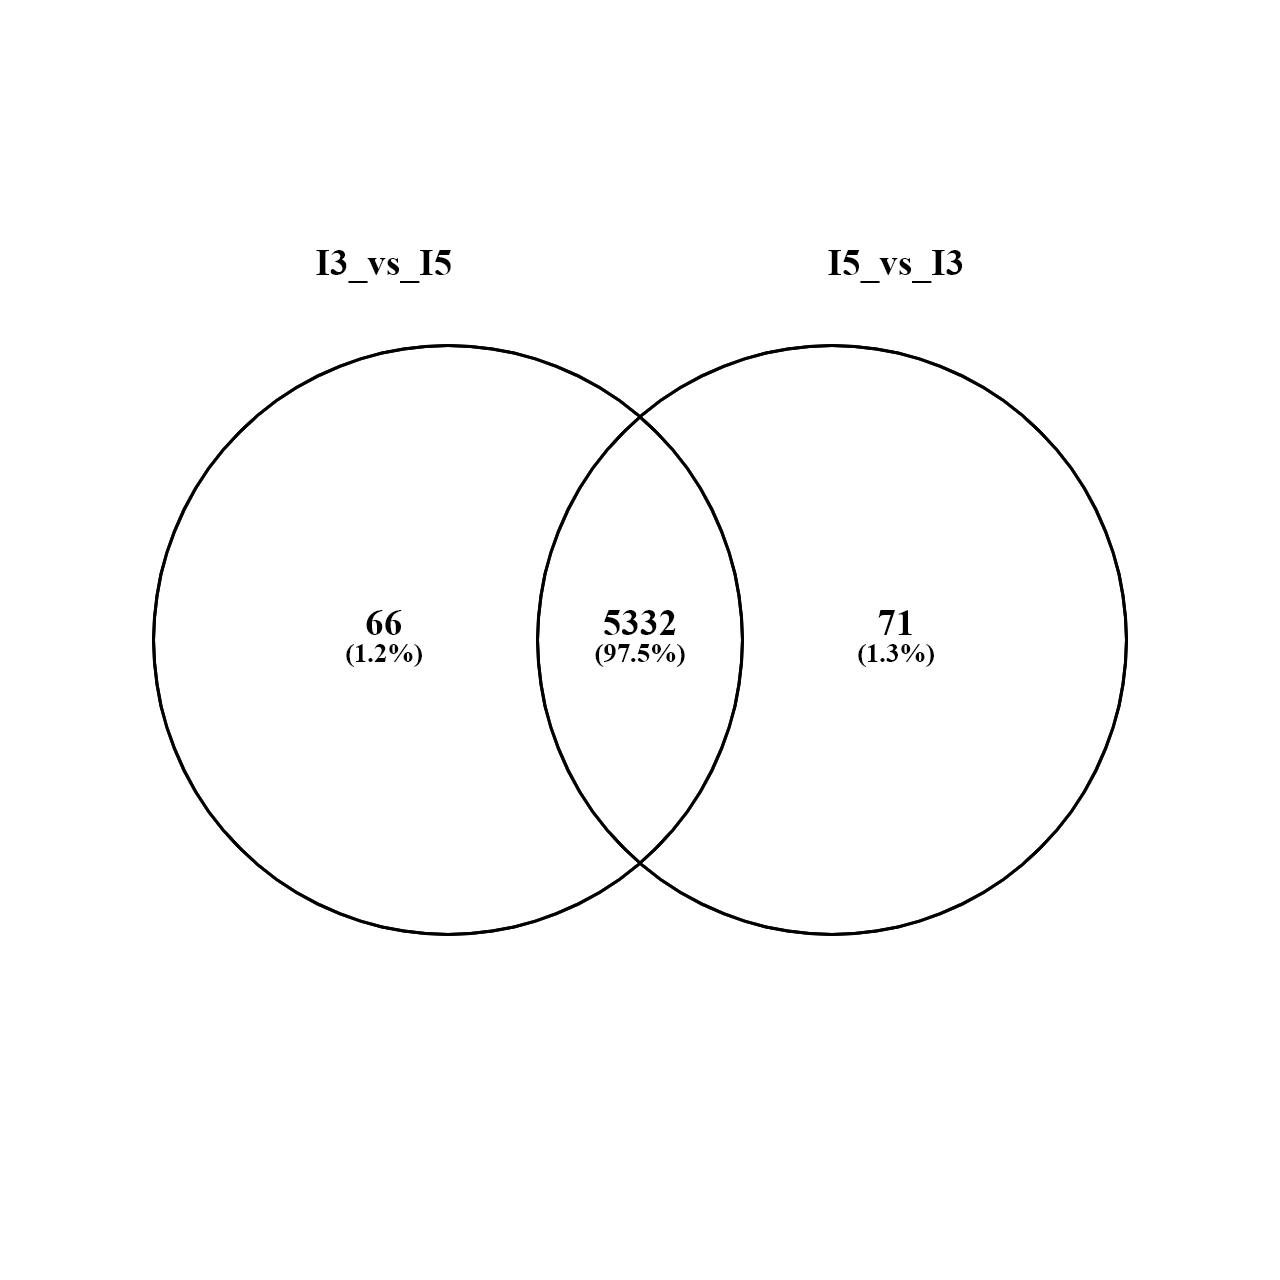
I looked at the results tables for these 'exclusive genes' (in the .csv file written before filtering as they do not appear in the results after filtering) and found that their lfc and p-values also change (somtimes drastically) depending on the denominator being used. I expected that flipping reference levels should only change the sign of the lfc and not add/remove some genes entirely. Was my expectation wrong?
Why this difference in the DEGs when switching reference levels? Let me know if I have missed any relevant info that is needed Ps: I have the count data for these 'exclusive genes' and can upload it if necessary.
Best regards,
Suvrat
sessionInfo()
R version 4.3.2 (2023-10-31 ucrt)
Platform: x86_64-w64-mingw32/x64 (64-bit)
Running under: Windows 10 x64 (build 19045)

Matrix products: default


locale:
[1] LC_COLLATE=English_India.utf8  LC_CTYPE=English_India.utf8    LC_MONETARY=English_India.utf8 LC_NUMERIC=C
[5] LC_TIME=English_India.utf8

time zone: Europe/Berlin
tzcode source: internal

attached base packages:
[1] stats4    stats     graphics  grDevices utils     datasets  methods   base

other attached packages:
 [1] RColorBrewer_1.1-3          pheatmap_1.0.12             ggplot2_3.4.4               dplyr_1.1.4
 [5] jsonlite_1.8.7              tximport_1.30.0             readr_2.1.4                 DESeq2_1.42.0
 [9] SummarizedExperiment_1.32.0 Biobase_2.62.0              MatrixGenerics_1.14.0       matrixStats_1.1.0
[13] GenomicRanges_1.54.1        GenomeInfoDb_1.38.1         IRanges_2.36.0              S4Vectors_0.40.1
[17] BiocGenerics_0.48.1

loaded via a namespace (and not attached):
 [1] utf8_1.2.4              generics_0.1.3          SparseArray_1.2.2       bitops_1.0-7            lattice_0.22-5
 [6] hms_1.1.3               magrittr_2.0.3          grid_4.3.2              Matrix_1.6-3            BiocManager_1.30.22
[11] fansi_1.0.5             scales_1.3.0            codetools_0.2-19        abind_1.4-5             cli_3.6.1
[16] rlang_1.1.2             crayon_1.5.2            XVector_0.42.0          munsell_0.5.0           withr_2.5.2
[21] DelayedArray_0.28.0     S4Arrays_1.2.0          tools_4.3.2             parallel_4.3.2          tzdb_0.4.0
[26] BiocParallel_1.36.0     colorspace_2.1-0        locfit_1.5-9.8          GenomeInfoDbData_1.2.11 vctrs_0.6.4
[31] R6_2.5.1                lifecycle_1.0.4         zlibbioc_1.48.0         pkgconfig_2.0.3         pillar_1.9.0
[36] gtable_0.3.4            glue_1.6.2              Rcpp_1.0.11             tibble_3.2.1            tidyselect_1.2.0
[41] rstudioapi_0.15.0       compiler_4.3.2          RCurl_1.98-1.13

Ah, I see. Thank you for the quick reply! The reference counts for these 'exclusive genes' are in fact dominated by zeroes. How would you suggest I continue? I am assuming I should choose one reference group and stick with it for all my comparisons. Also should I filter out these exclusive genes from my final list of DEGs? I am still learning to do this sort of analysis and unsure about the best way to do it.
Yes I recommend to stick to one reference group for the analysis.
You do not need to filter them. Sometimes users filter genes where all conditions have mostly zeros. But this is optional.