
Hello,
Apologies for any confusion in logic, I'm not very familiar with R. I am using DESeq2 to retrieve differential gene expression information for the following experimental design:
96 samples total, each of which are classified under 4 factors (in order of hierarchy):
- Tissue (brain, pancreas)
- Genotype (KO, WT)
- Treatment (Control, Low, High)
- Sex (M, F)
Here is the head of my metadata file for reference:
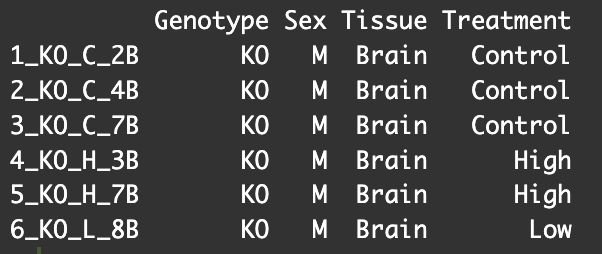
For now, I am mainly concerned with genotype, tissue, and treatment. My goals are to compare the following:
- WT control-treatment samples versus KO control-treatment samples within each tissue (i.e. Brain WT control vs Brain KO control; pancreas WT control vs pancreas KO control)
- WT high-treatment vs WT control-treatment within each tissue (i.e. brain WT high vs brain WT control; pancreas WT high vs pancreas WT control)
- WT low-treatment vs WT control-treatment within each tissue
- Repeat 2 and 3 but for KO samples
I have seen some helpful blog posts on Bioconductor, worked through the Harvard Chan Bioinformatics Core github course, and referenced the Bioconductor DESeq2 Analysis guide, however my dataset includes more factors than I've seen in examples, so my main sources of confusion are as follows:
- How do I appropriately subset my target samples for DESeq analysis? I believe I'll need to run a LRT due to how many nested factors I have and how large my dataset is (26000+ genes), but I'm not sure how to properly isolate the tissue samples (i.e. brain samples only; pancreas samples only). I've seen 2 methods of approach: a) form a completely new column of factors as such:
allCounts <- read.xlsx("RNAseq_allCounts.xlsx", rowNames = TRUE)
allMetadata <- read.xlsx("RNAseq_metadata.xlsx", rowNames = TRUE)

allMetadata$Tissue_Geno <- paste(allMetadata$Tissue, allMetadata$Genotype, sep = "_")

dds <- DESeqDataSetFromMatrix(countData = allCounts, colData = allMetadata, design = ~ Tissue_Geno)
dds <- DESeq(dds)
res <- results(dds, contrast=c("Tissue_Geno", "Brain_WT_control", "Brain_KO_control")) #this is where my code does not suffice because I'm only defining 2 factors (tissue type, genotype) to contrast when I need to define 3 factors (tissue type, genotype, treatment)
b) compare a full vs reduced dataset using LRT:
dds_lrt <- DESeq(dds, test="LRT", reduced=~Genotype:Treatment) #brief summary of code because I don't know the proper syntax for my desired result
Initially to approach this issue, I used the following code, but I'm not confident that this was correct:
brain_dds <-dds[dds$Tissue == "Brain"] #creates subset of all genotypes from brain
brain_ctrl_dds <-brain_dds[brain_dds$Treatment == "Control"] #subset of all genotypes from brain exposed to control
brain_wt_dds <-brain_dds[brain_dds$Genotype == "WT"] #subset of genotypes from wildtype brain
brain_ko_dds <-brain_dds[brain_dds$Genotype == "KO"] #subset of genotypes from knockout brain

brain_dds$Genotype <- relevel(brain_dds$Genotype, ref = "WT")
brain_ctrl_dds$Genotype <- relevel(brain_ctrl_dds$Genotype, ref = "WT")
brain_wt_dds$Treatment <- relevel(brain_wt_dds$Treatment, ref = "Control")
brain_ko_dds$Treatment <- relevel(brain_ko_dds$Treatment, ref = "Control")

#I modified the following code to fit each of the 4 subsets above:
brain_wt_dds<-DESeq(brain_wt_dds)
resultsNames(brain_wt_dds)
brain_wt_hi <- results(brain_wt_dds, name="Treatment_High_vs_Control")
brain_wt_hi_sig <-as.data.frame(subset(brain_wt_hi, padj < 0.05))
DEGBrain_WT_HighvsCtrl <- "my/path/DEGBrain2_WT_HighvsCtrl.csv"
write.csv(brain_wt_hi_sig, DEGBrain_WT_HighvsCtrl, row.names = TRUE)
- After running a LRT, since this only gives me the statistical likelihood of occurrence, should I follow up with a Wald test to retrieve the correct log2FC and FDR-adjusted p-values? I understand the the DESeq default test is the Wald test, so would I need to create a subset of the results from the LRT then feed it into a Wald test?
Any help would be greatly appreciated, thank you!

New post is below:
DESeq2 multi-factor design and interaction terms