Entering edit mode
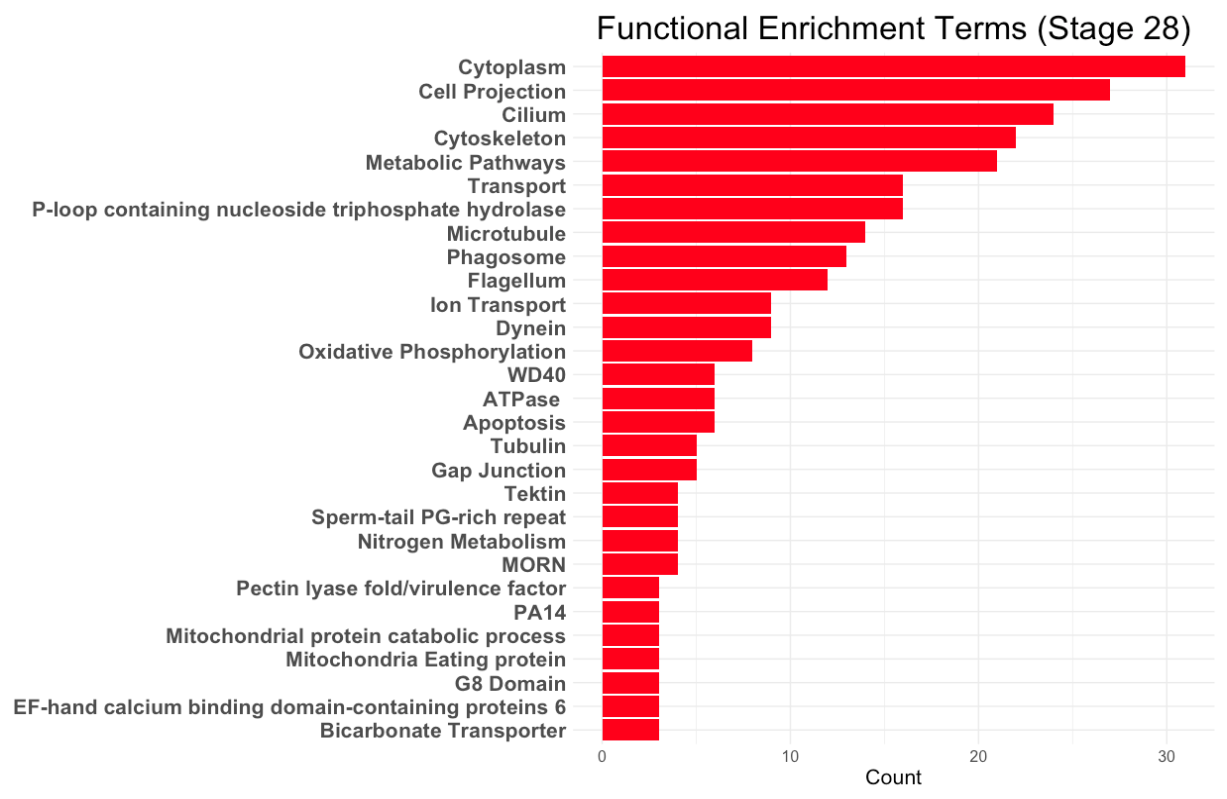
Hello, I just had a quick question about what "counts" is in ClusterProfiler. I am doing a project looking at functional enrichment of gene sets, and getting a graphical output using GSEA. I am just not sure what "counts" means in the graph that we get as a result. Here is an example of the graph we get. Thanks!


