Entering edit mode

Dear, I m using DEXSeq in order to analyse DEU. I got a result table with DEXSeq() function, I got many interesting differential exon usage with padj <0.05 but for one of them I got 2 exons with padj very low but in result table I got NA values for groups values and log2foldchange as:
groupID featureID exonBaseMean  dispersion     stat       pvalue         padj HC_ZT3 ORM1h
ENSMUSG00000005089:E001 ENSMUSG00000005089      E001     685.2941 0.001725370 33.03974 9.029436e-09 1.992781e-05     NA    NA
ENSMUSG00000005089:E034 ENSMUSG00000005089      E034   45712.1062 0.001449945 14.68005 1.273875e-04 4.215027e-02     NA    NA
                        log2fold_ORM1h_HC_ZT3 genomicData.seqnames genomicData.start genomicData.end genomicData.width genomicData.strand
ENSMUSG00000005089:E001                    NA                    2         102489004       102489567               564                  +
ENSMUSG00000005089:E034                    NA                    2         102612089       102621129              9041                  +
                        countData.NC_HC_AM1 countData.NC_HC_AM2 countData.NC_HC_AM3 countData.NC_HC_AM4 countData.NC_HC_AM5 countData.NC_HC_AM6
ENSMUSG00000005089:E001                 343                 301                 338                 356                 301                 398
ENSMUSG00000005089:E034               24285               24536               26479               28804               25330               33677
                        countData.NC_ORM1h1 countData.NC_ORM1h2 countData.NC_ORM1h3 countData.NC_ORM1h4 countData.NC_ORM1h5 countData.NC_ORM1h6
ENSMUSG00000005089:E001                1014                1221                1390                1099                 896                 822
ENSMUSG00000005089:E034               57453               78122               96298               68502               51991               49220
                         transcripts
ENSMUSG00000005089:E001 ENSMUST0....
ENSMUSG00000005089:E034 ENSMUST0....
with that result, I wanted to draw a plot with:
DTU_exon.usage_NC <- plotDEXSeq( dxr.fc_NC, "ENSMUSG00000005089",
                             legend=TRUE,
                             cex.axis=1.2, #1.2
                             cex=1.5,
                             lwd=2,
                             color=c("#0000FF80", "#FF000080"),
                             expression=FALSE,
                             splicing=TRUE,
                             displayTranscripts=TRUE)
and I got:
Fit for gene/exon ENSMUSG00000005089 threw the next warning(s): the matrix is either rank-deficient or indefinite
and
> plot(DTU_exon.usage_NC)
Error in plot.window(...) : 'xlim' nécessite des valeurs finies
In addition: Warning messages:
1: In min(x) : no non-missing arguments to min; returning Inf
2: In max(x) : no non-missing arguments to max; returning -Inf
3: In min(x) : no non-missing arguments to min; returning Inf
4: In max(x) : no non-missing arguments to max; returning -Inf
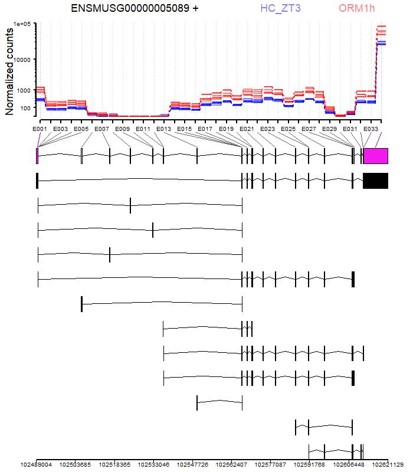
Is there a solution to fix the issue? and something is strange because I could get a plot with the following code:
DTU_exon.usage_NC <- plotDEXSeq( dxr.fc_NC, "ENSMUSG00000005089",
                             legend=TRUE,
                             cex.axis=1.2, #1.2
                             cex=1.5,
                             lwd=2,
                             color=c("#0000FF80", "#FF000080"),
                             expression=FALSE,
                             splicing=FALSE,
                             displayTranscripts=TRUE,
                             norCounts = T)
Thanks in advance
-Jc