Entering edit mode
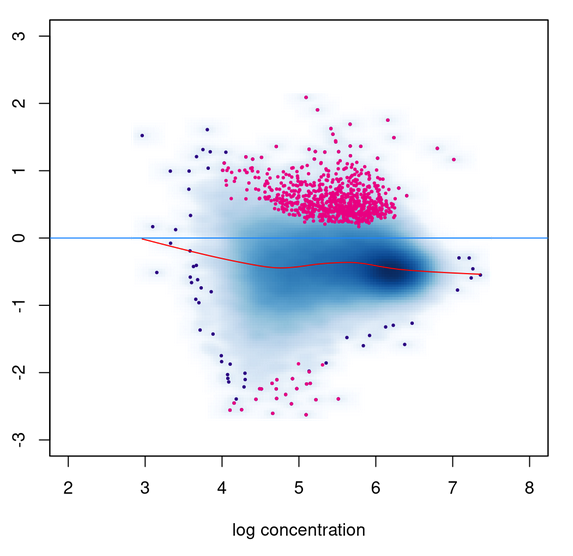
I am comparing the results of DESeq2 'background' normalization with library size normalization with two different spike-ins (specified using the SpikeIn column in the samplesheet). I am getting the exact same Pvalues for all three methods. I did check that the DBA$norm$DESeq2$norm.facs values are different in each case. The MA plot using normalized counts also does not seem to be consistent with the DB sites called; lots of up-regulated sites called even though the distribution is globally shifted to <0 fold change.
dba.plotMA(diffbind, contrast=1, th = fdr_cutoff)
# make DBA object
diffbind <- dba(sampleSheet = samples %>% dplyr::select(-out_pref))

# set num cores and how many reads to store in memory
diffbind$config$cores <- db_config$cores-1
diffbind$config$yieldSize <- 20000000

# get counts
diffbind$config$scanbamparam <- ScanBamParam(flag = scanBamFlag(isDuplicate=FALSE, isSecondaryAlignment=FALSE, isSupplementaryAlignment=FALSE, isPaired=TRUE, isProperPair=TRUE, isNotPassingQualityControls=FALSE, isUnmappedQuery=FALSE, hasUnmappedMate=FALSE, isMinusStrand=NA, isMateMinusStrand=NA))


# get counts

diffbind <- dba.count(diffbind, summits=DB_summits, bUseSummarizeOverlaps = TRUE, bParallel = TRUE)
print(diffbind)

# normalization
if ("Spikein" %in% colnames(samples)){
    diffbind <- dba.normalize(diffbind, normalize=DBA_NORM_LIB, spikein=TRUE)
} else{
    diffbind <- dba.normalize(diffbind, normalize = DBA_NORM_NATIVE, background = TRUE)
}

# print the normalization methods
dba.normalize(diffbind, bRetrieve=TRUE)

comps <- list(
  list("GroupA", "GroupB")
)

for (comp in comps){
  diffbind <- dba.contrast(diffbind,
                           group1=diffbind$masks[[ comp[[1]] ]],
                           group2=diffbind$masks[[ comp[[2]] ]],
                           name1=comp[[1]],
                           name2=comp[[2]])
}

dba.show(diffbind, bContrasts=TRUE)

diffbind <- dba.analyze(diffbind, bBlacklist=FALSE, bGreylist=FALSE)
dba.show(diffbind, bContrasts = TRUE)
## R version 4.2.1 (2022-06-23)
## Platform: x86_64-pc-linux-gnu (64-bit)
## Running under: AlmaLinux 9.0 (Emerald Puma)
##
## Matrix products: default
## BLAS:   /opt/R/R-4.2.1/lib64/R/lib/libRblas.so
## LAPACK: /opt/R/R-4.2.1/lib64/R/lib/libRlapack.so
##
## locale:
##  [1] LC_CTYPE=C.UTF-8       LC_NUMERIC=C           LC_TIME=C.UTF-8
##  [4] LC_COLLATE=C.UTF-8     LC_MONETARY=C.UTF-8    LC_MESSAGES=C.UTF-8
##  [7] LC_PAPER=C.UTF-8       LC_NAME=C              LC_ADDRESS=C
## [10] LC_TELEPHONE=C         LC_MEASUREMENT=C.UTF-8 LC_IDENTIFICATION=C
##
## attached base packages:
## [1] stats4    stats     graphics  grDevices utils     datasets  methods
## [8] base
##
## other attached packages:
##  [1] enrichplot_1.18.4
##  [2] readxl_1.4.2
##  [3] openxlsx_4.2.5.2
##  [4] ReactomePA_1.42.0
##  [5] DOSE_3.24.2
##  [6] clusterProfiler_4.6.2
##  [7] org.Mm.eg.db_3.16.0
##  [8] ChIPseeker_1.34.1
##  [9] TxDb.Mmusculus.UCSC.mm10.knownGene_3.10.0
## [10] GenomicFeatures_1.50.4
## [11] AnnotationDbi_1.60.2
## [12] cowplot_1.1.1
## [13] ggplot2_3.4.2
## [14] lattice_0.21-8
## [15] gridExtra_2.3
## [16] patchwork_1.1.2
## [17] rtracklayer_1.58.0
## [18] Rsamtools_2.14.0
## [19] Biostrings_2.66.0
## [20] XVector_0.38.0
## [21] kableExtra_1.3.4
## [22] DiffBind_3.8.4
## [23] SummarizedExperiment_1.28.0
## [24] Biobase_2.58.0
## [25] MatrixGenerics_1.10.0
## [26] matrixStats_0.63.0
## [27] GenomicRanges_1.50.2
## [28] GenomeInfoDb_1.34.9
## [29] IRanges_2.32.0
## [30] S4Vectors_0.36.2
## [31] BiocGenerics_0.44.0
## [32] readr_2.1.4
## [33] stringr_1.5.0
## [34] dplyr_1.1.2
##
## loaded via a namespace (and not attached):
##   [1] utf8_1.2.3
##   [2] tidyselect_1.2.0
##   [3] RSQLite_2.3.1
##   [4] htmlwidgets_1.6.2
##   [5] grid_4.2.1
##   [6] BiocParallel_1.32.6
##   [7] scatterpie_0.1.9
##   [8] munsell_0.5.0
##   [9] codetools_0.2-19
##  [10] interp_1.1-4
##  [11] systemPipeR_2.4.0
##  [12] withr_2.5.0
##  [13] colorspace_2.1-0
##  [14] GOSemSim_2.24.0
##  [15] filelock_1.0.2
##  [16] highr_0.10
##  [17] knitr_1.42
##  [18] rstudioapi_0.14
##  [19] labeling_0.4.2
##  [20] bbmle_1.0.25
##  [21] GenomeInfoDbData_1.2.9
##  [22] mixsqp_0.3-48
##  [23] hwriter_1.3.2.1
##  [24] polyclip_1.10-4
##  [25] bit64_4.0.5
##  [26] farver_2.1.1
##  [27] downloader_0.4
##  [28] treeio_1.22.0
##  [29] coda_0.19-4
##  [30] vctrs_0.6.2
##  [31] generics_0.1.3
##  [32] gson_0.1.0
##  [33] xfun_0.39
##  [34] BiocFileCache_2.6.1
##  [35] R6_2.5.1
##  [36] apeglm_1.20.0
##  [37] graphlayouts_0.8.4
##  [38] invgamma_1.1
##  [39] locfit_1.5-9.7
##  [40] bitops_1.0-7
##  [41] cachem_1.0.7
##  [42] fgsea_1.24.0
##  [43] gridGraphics_0.5-1
##  [44] DelayedArray_0.24.0
##  [45] BiocIO_1.8.0
##  [46] scales_1.2.1
##  [47] ggraph_2.1.0
##  [48] gtable_0.3.3
##  [49] tidygraph_1.2.3
##  [50] rlang_1.1.3
##  [51] systemfonts_1.0.4
##  [52] splines_4.2.1
##  [53] lazyeval_0.2.2
##  [54] yaml_2.3.7
##  [55] reshape2_1.4.4
##  [56] qvalue_2.30.0
##  [57] tools_4.2.1
##  [58] ggplotify_0.1.0
##  [59] gplots_3.1.3
##  [60] jquerylib_0.1.4
##  [61] RColorBrewer_1.1-3
##  [62] Rcpp_1.0.10
##  [63] plyr_1.8.8
##  [64] progress_1.2.2
##  [65] zlibbioc_1.44.0
##  [66] purrr_1.0.1
##  [67] RCurl_1.98-1.12
##  [68] prettyunits_1.1.1
##  [69] deldir_1.0-6
##  [70] viridis_0.6.2
##  [71] ashr_2.2-54
##  [72] ggrepel_0.9.3
##  [73] magrittr_2.0.3
##  [74] data.table_1.14.8
##  [75] reactome.db_1.82.0
##  [76] truncnorm_1.0-9
##  [77] mvtnorm_1.1-3
##  [78] SQUAREM_2021.1
##  [79] amap_0.8-19
##  [80] xtable_1.8-4
##  [81] hms_1.1.3
##  [82] evaluate_0.23
##  [83] HDO.db_0.99.1
##  [84] XML_3.99-0.14
##  [85] emdbook_1.3.12
##  [86] jpeg_0.1-10
##  [87] compiler_4.2.1
##  [88] biomaRt_2.54.1
##  [89] bdsmatrix_1.3-6
##  [90] tibble_3.2.1
##  [91] shadowtext_0.1.2
##  [92] KernSmooth_2.23-20
##  [93] crayon_1.5.2
##  [94] htmltools_0.5.5
##  [95] ggfun_0.0.9
##  [96] tzdb_0.3.0
##  [97] geneplotter_1.76.0
##  [98] tidyr_1.3.0
##  [99] aplot_0.1.10
## [100] DBI_1.1.3
## [101] tweenr_2.0.2
## [102] dbplyr_2.3.2
## [103] MASS_7.3-59
## [104] rappdirs_0.3.3
## [105] boot_1.3-28.1
## [106] ShortRead_1.56.1
## [107] Matrix_1.5-4
## [108] cli_3.6.1
## [109] parallel_4.2.1
## [110] igraph_1.4.2
## [111] pkgconfig_2.0.3
## [112] TxDb.Hsapiens.UCSC.hg19.knownGene_3.2.2
## [113] GenomicAlignments_1.34.1
## [114] numDeriv_2016.8-1.1
## [115] xml2_1.3.3
## [116] annotate_1.76.0
## [117] ggtree_3.6.2
## [118] svglite_2.1.1
## [119] bslib_0.4.2
## [120] webshot_0.5.4
## [121] rvest_1.0.3
## [122] yulab.utils_0.0.6
## [123] digest_0.6.34
## [124] graph_1.76.0
## [125] cellranger_1.1.0
## [126] rmarkdown_2.21
## [127] fastmatch_1.1-3
## [128] tidytree_0.4.2
## [129] restfulr_0.0.15
## [130] GreyListChIP_1.30.0
## [131] curl_5.0.1
## [132] graphite_1.44.0
## [133] gtools_3.9.4
## [134] rjson_0.2.21
## [135] lifecycle_1.0.3
## [136] nlme_3.1-162
## [137] jsonlite_1.8.7
## [138] viridisLite_0.4.1
## [139] limma_3.54.2
## [140] BSgenome_1.66.3
## [141] fansi_1.0.4
## [142] pillar_1.9.0
## [143] plotrix_3.8-2
## [144] KEGGREST_1.38.0
## [145] fastmap_1.1.1
## [146] httr_1.4.5
## [147] GO.db_3.16.0
## [148] glue_1.6.2
## [149] zip_2.3.0
## [150] png_0.1-8
## [151] bit_4.0.5
## [152] ggforce_0.4.1
## [153] stringi_1.7.12
## [154] sass_0.4.5
## [155] blob_1.2.4
## [156] DESeq2_1.38.3
## [157] latticeExtra_0.6-30
## [158] caTools_1.18.2
## [159] memoise_2.0.1
## [160] irlba_2.3.5.1
## [161] ape_5.7-1


To help make it easier to reproduce this issue, I was able to reproduce similar behavior using the included tamoxifen dataset. I also realized that while the PValues are identical, the 'Conc' columns are distinct.
Packages loaded
Library size norm
Background counts RLE
Compare results
SessionInfo