Hi
I am currently analyzing RNASeq data, having used HISAT2 for mapping and StringTie for quantification. I've proceeded to use DESeq2 for differential expression analysis, but I've encountered an issue where many of the differentially expressed genes (DEGs) identified are lowly expressed according to the count matrix. Could this suggest a potential error in my analysis process?
I would greatly appreciate any guidance or suggestions you might have to help address this issue.
Best Rajat


Dear Dr. Michael
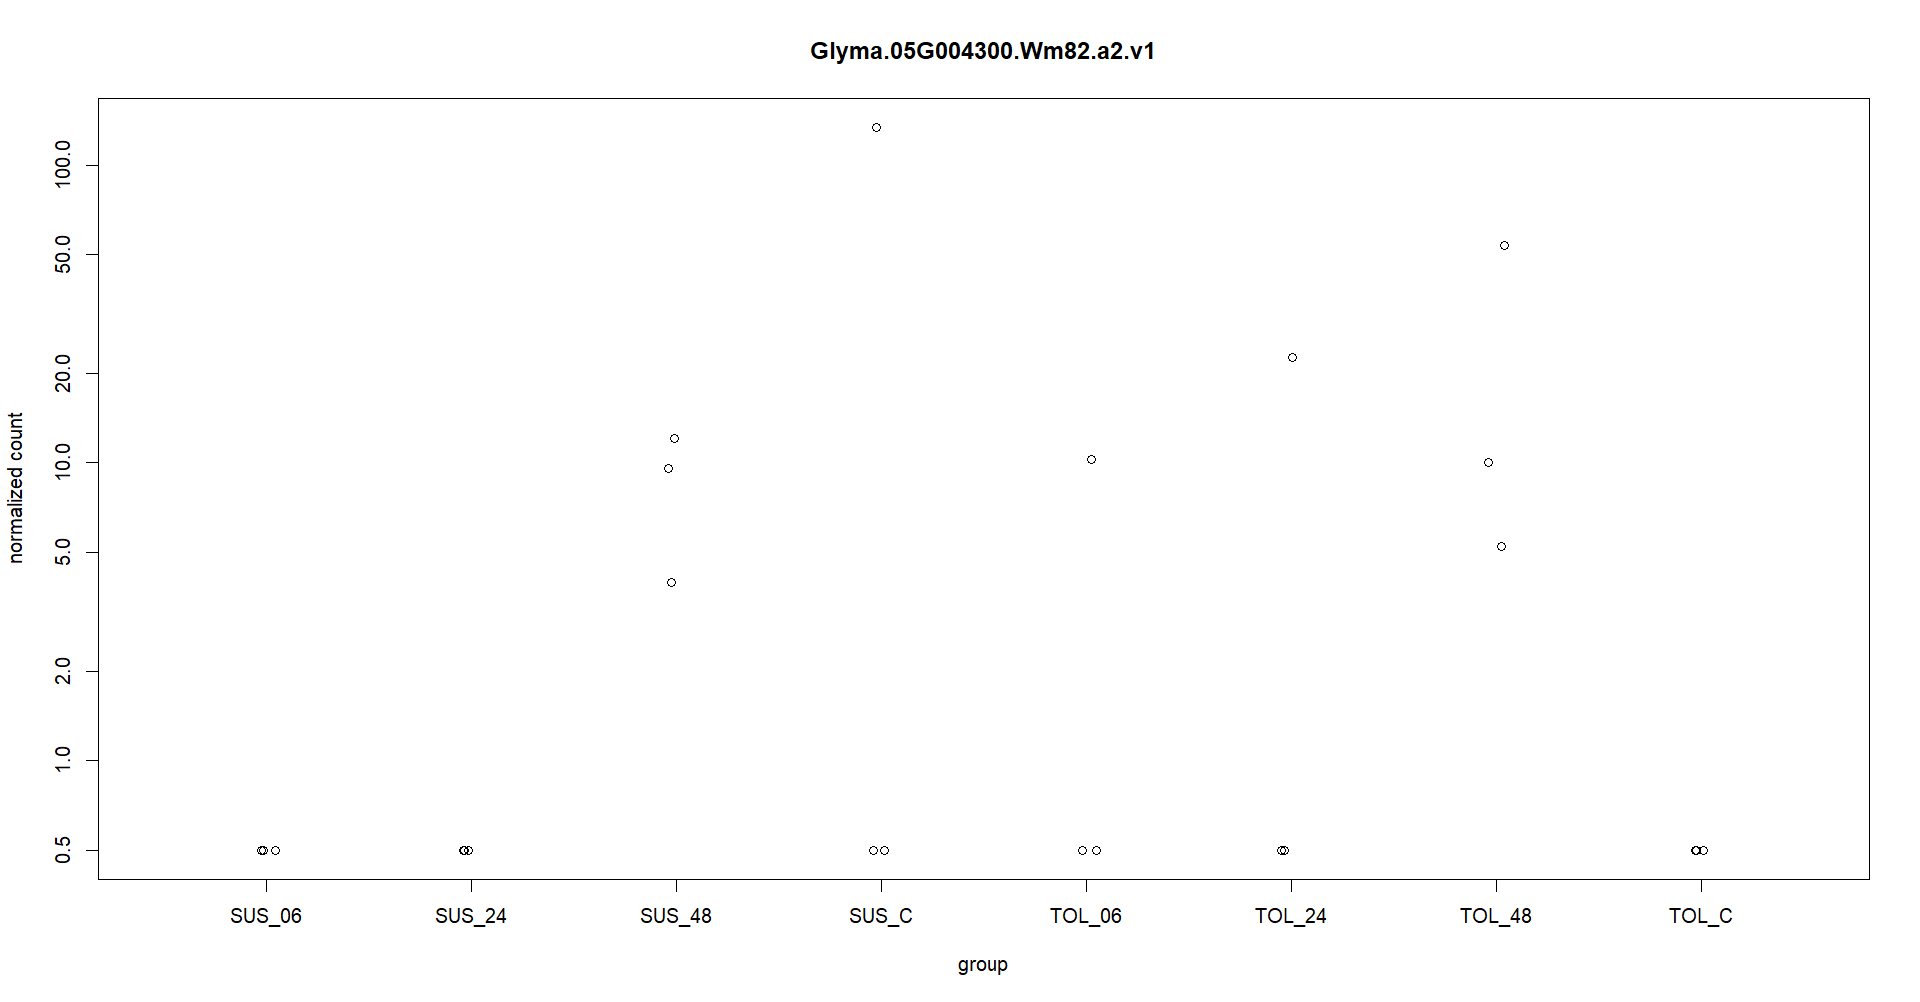
Thanks for you quick reply. I appreciate it. Attached is the plotcounts for one gene. I am experiencing like this in other genes as well. Also I am providing the log2fold change at different timepoints. geneID SUS_C vs SUS_06 SUS_C vs SUS_24 SUS_C vs SUS_48 TOL_C vs TOL_06 TOL_C vs TOL_24 TOL_C vs TOL_48 Glyma.05G004300 -19.32637569 -40.69880385 -2.467047927 36.75696216 37.9392758 39.54766649
Here in the figure, expression in one replication in TOL_6 and TOL_24 is making gene significantly upregulate with adj pvalue significantly less than 0.01. So, this is making me worry if I am analyzing my data wr
These counts are too low, only a few samples above a count of 10. So for typical RNA-seq data that is underpowered to call differences.
It's hard to distinguish from