Entering edit mode

Hi all,
When I use limma to compare pathway score between 3 groups, I tried two ways:
- Keep 3 groups in the data and use
coefto specific which 2 groups I want to compare. - Omit the group I don't want to compare in the data.
The result when filter p value < 0.05 in both way is the same when I compare late state vs control. But the result is slightly different (599 vs 600 pathways) when I compare early state vs control. Would you please have an explanation? Thank you so much!paths_results_ES_NC <- topTable(fit2, adjust="BH", number=Inf, coef = "ESvsNC") filtered_paths_ES_NC <- paths_results_ES_NC[paths_results_ES_NC$P.Value < 0.05, ]

Thanks Gordon. My statistic knowledge currently is quite limit, so just want to make sure the result is correct. If I use adjusted P. Value, with large number of pathways like thousands, no p value is remain significant. So I think I may miss some significant pathway because the nature of the data and the sample size for early state and late state are far less than normal control.
I have answered many questions and comments from you about this same analysis on this forum and on Biostars. I have previously explained why omiting a group is not good practice and why it might change the results. I have previously explained that unequal sample sizes do not cause a problem. I made several suggestions how you might refine your analysis. I explained to you that pathway methods based on computing single-sample-scores are not a powerful way to find differentially expressed pathways. I suggested that you plot your data to explore whether there were any differences between the groups or any problems with the analysis. I even provided you with exact code for making the plot. The software seems to be working correctly so I don't know what more to say.
I really appreciate your support.
Hi Gordon, thank you so much for your guide! I check my data as you said there is no difference in my data. This is the MDS plot at genes level. I don't have the raw data but I think the normalized data. So can we say from the plot that there is no difference between normal control (black) and late state (red)? Just curious I have 2 big clusters. Is that because of batch effect? I am so sorry the previous MDS plot in other post!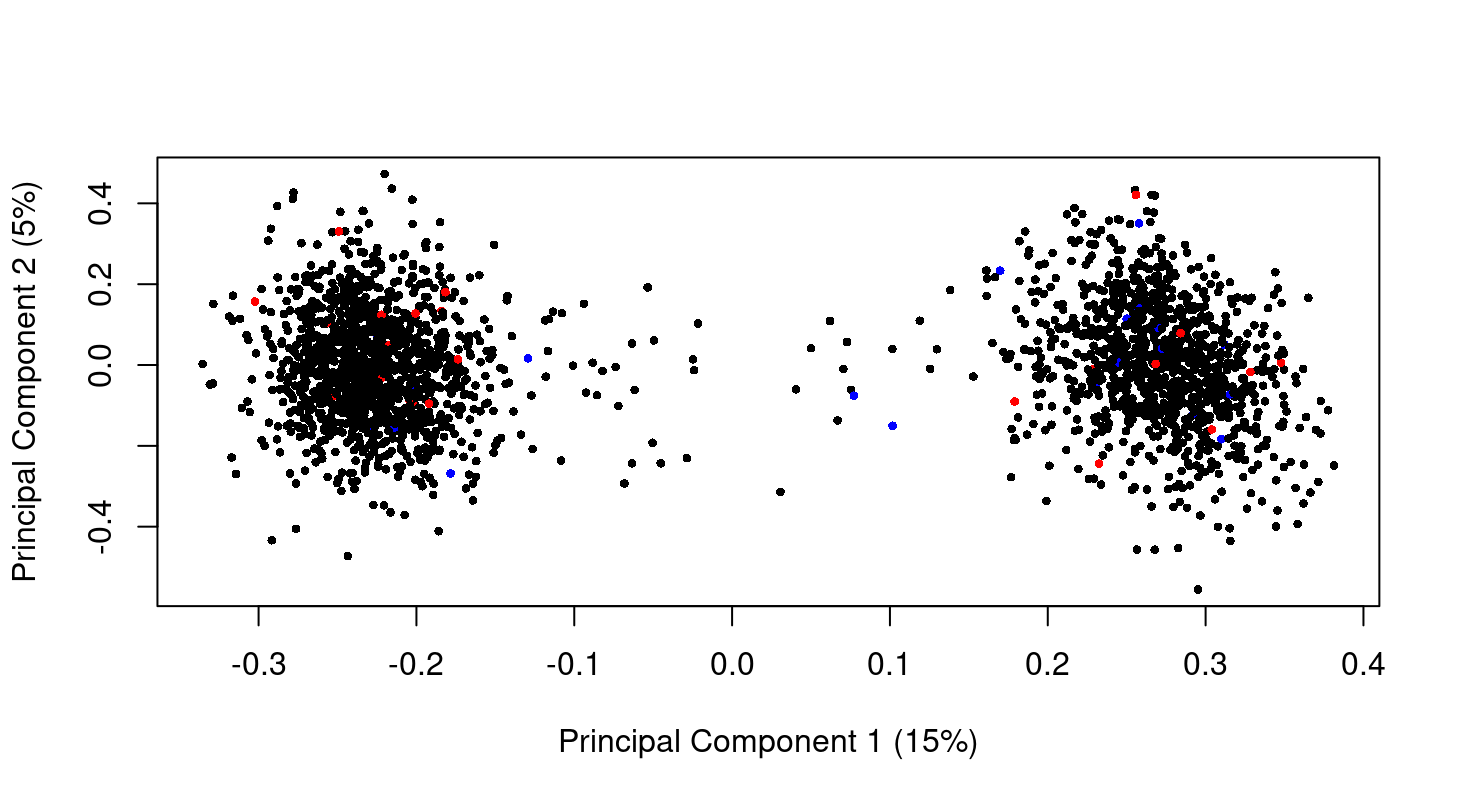
The MDS plot shows a massive batch effect. If this is a correct plot of your data, then any analysis you have done of this data is worthless because you have not modelled the true nature of the data. The first steps of any analysis are to plot and normalize the data. You need to complete these steps satisfactorily before proceeding to any DE analysis.
I must say that the plot looks somewhat artificial compared to real microarray or RNA-seq data. According to your comments, you don't seem to know the nature of your data, what it is and how it has been normalized.
Hi Gordon,
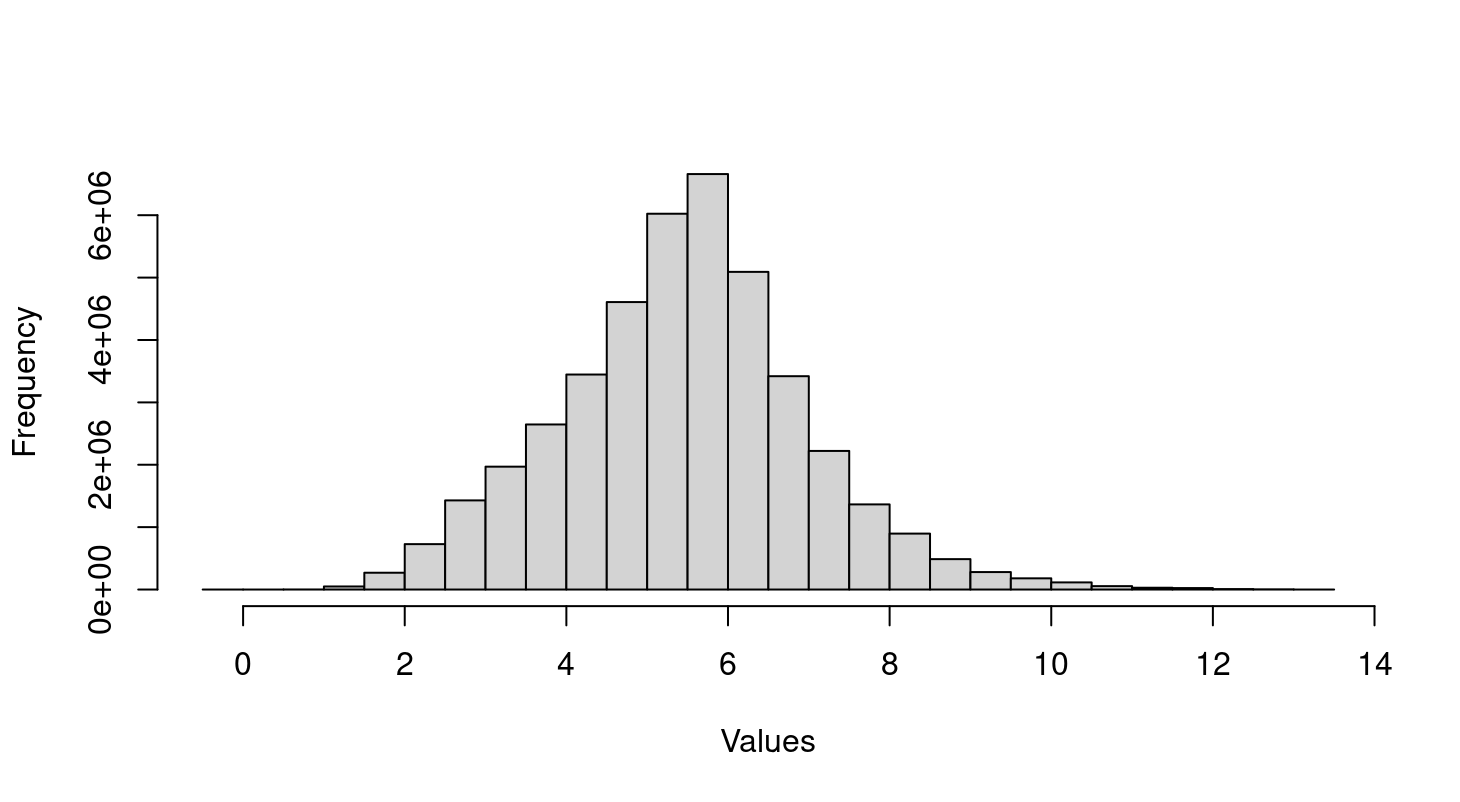
Thank you so much for your guide! I don't handle the raw data but a text file with all samples that already normalized as you see in the histogram. So I need the raw data and use
combat()to handle batch effect? So the text file I got, it haven't removed batch effect but normalized and log transform? The person gave me the data is not the one generate the data so she doesn't know all the information. With large number of sample, the data was created from 2005 to 2008.I can't tell you how to analyse your particular dataset. I can only give general advice and help with limma syntax. I don't even know what sort of data you have, whether it is RNA-seq, microarray, proteomics or whatever. In terms of general advice, I like to have raw data but normalized data might be fine depending on what the technology is and whether the normalization was appropriate. There is never any need for combat(). You need to find out the biological cause of the batch effect, not blindly try to remove it. Once you know the cause, the extra factor is incorporated into the limma linear model. At very least, you should be exploring batch effects over time.
Hi Gordon, thank you so much for further guidance! I discussed this issue with psychiatrist who treat Alzheimer patients and they don't expect significant difference in gene expression from peripheral blood sample between disease and control. Based on the distribution of microarray value in histogram above, I think the data normalized and log transformed. So does the batch effect causes two big clusters?
If I use limma to compare a few thousand pathways between 3 groups, pathway A will got different p value with the case using only a few pathways. P adj will change but I don't know why p value of the same pathway also change. Basically, I just compare more. So p value of pathway A should be the same regardless number of pathway I use to compare, right? The result of this pathway should independent with other pathways. Would you please explain?