Entering edit mode

Hello, Thanks to you, I was able to easily enter bioinformatics.
I'm analyzing bulk RNA-seq for the first time. I've drawn the count plots of DEGs, but I don't understand the sign of the LFC.
Code should be placed in three backticks as shown below
# use DESeq()
dds_ver2 <- DESeqDataSetFromTximport(txi_ver2, colData = meta_ver2, design = ~sampletype_ver2)
dds_ver2 <- estimateSizeFactors(dds_ver2)
dds_ver2 <- DESeq(dds_ver2)

# use results()
res_h_d_ver2_noShrink <- results(dds_RUVg_ver2, contrast = c("sampletype_ver2","Lgr5_DTA","Homeostasis"), independentFiltering = F)
Then, I plotted count plot
# get DEGs
res_h_d_ver2_noShrink_tb <- res_h_d_ver2_noShrink %>% data.frame() %>% rownames_to_column(var='gene') %>% as_tibble()
res_h_d_ver2_noShrink_tb <- merge(res_h_d_ver2_noShrink_tb, vM34annot, by.x='gene', by.y='ensgene')
sig_h_d_up_ver2 <- res_h_d_tb_ver2_noShrink_tb %>% filter(padj < 0.05) %>% filter(log2FoldChange>=1)
sig_h_d_down_ver2 <- res_h_d_tb_ver2_noShrink_tb %>% filter(padj < 0.05) %>% filter(log2FoldChange<=-1)
sig_h_d_both_ver2 <- bind_rows(sig_h_d_up_ver2,sig_h_d_down_ver2)

# Count plots of DEGs
ordered_sig_h_d_ver2 <- sig_h_d_both_ver2[order(sig_h_d_both_ver2$log2FoldChange, decreasing =TRUE),]
sig_h_d_ver2_symbol <- ordered_sig_h_d_ver2$symbol
sig_h_d_ver2_ensname <- ordered_sig_h_d_ver2$gene
for (i in 1:29){
  DEG_h_d_ver2[[i]] <- plotCounts(dds_h_d_ver2,
                                  gene = sig_h_d_ver2_ensname[i],
                                  intgroup = "sampletype_h_d_ver2",
                                  returnData = TRUE)
}
for (i in 1:29){
  data <- DEG_h_d_ver2[[i]]
  title <- sig_h_d_ver2_symbol[i]
  q <- ggplot(data, aes(x=sampletype_h_d_ver2, y=count, color=sampletype_h_d_ver2))+
    geom_boxplot(width=0.3, show.legend = F)+
    geom_point(size=5, position=position_jitter(w=0.1,h=0))+
    geom_text_repel(aes(label=rownames(data)), size=4, show.legend = F)+
    ggtitle(paste("[DEG - Homeostasis vs. Lgr5-DTA] ", title))+
    theme(plot.title = element_text(hjust = 0.5), aspect.ratio = 1)+
    annotate("text", x=0.5, y=Inf,
             label = paste("padj = ", format(ordered_sig_h_d_ver2[i,]$padj, scientific = TRUE)),
             hjust = 0, vjust = 1)+
    annotate("text", x=0.5, y=Inf,
             label = paste("LFC = ", round((ordered_sig_h_d_ver2[i,]$log2FoldChange),digits =2)),
             hjust = 0, vjust = 3)+
    scale_color_manual(values = c("#f8766d","#00ba38"))

  ggsave(paste("plot_ver2/DEG_count_plots/1_sig_h_d_ver2/DEG_Hom_vs_Lgr5_DTA_",i,"_",title, ".png", sep = ""), plot = q, width = 8, height = 8, units = "in")
}
I understand that LFC converges to zero when the variance is large and that the LFC calculation in DESeq2 is not just treatment/control.
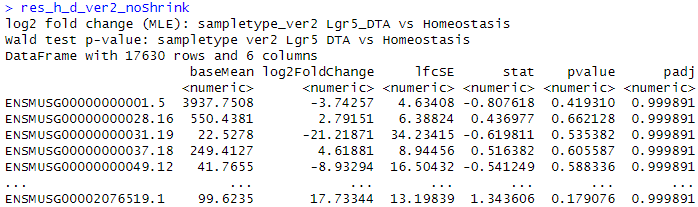
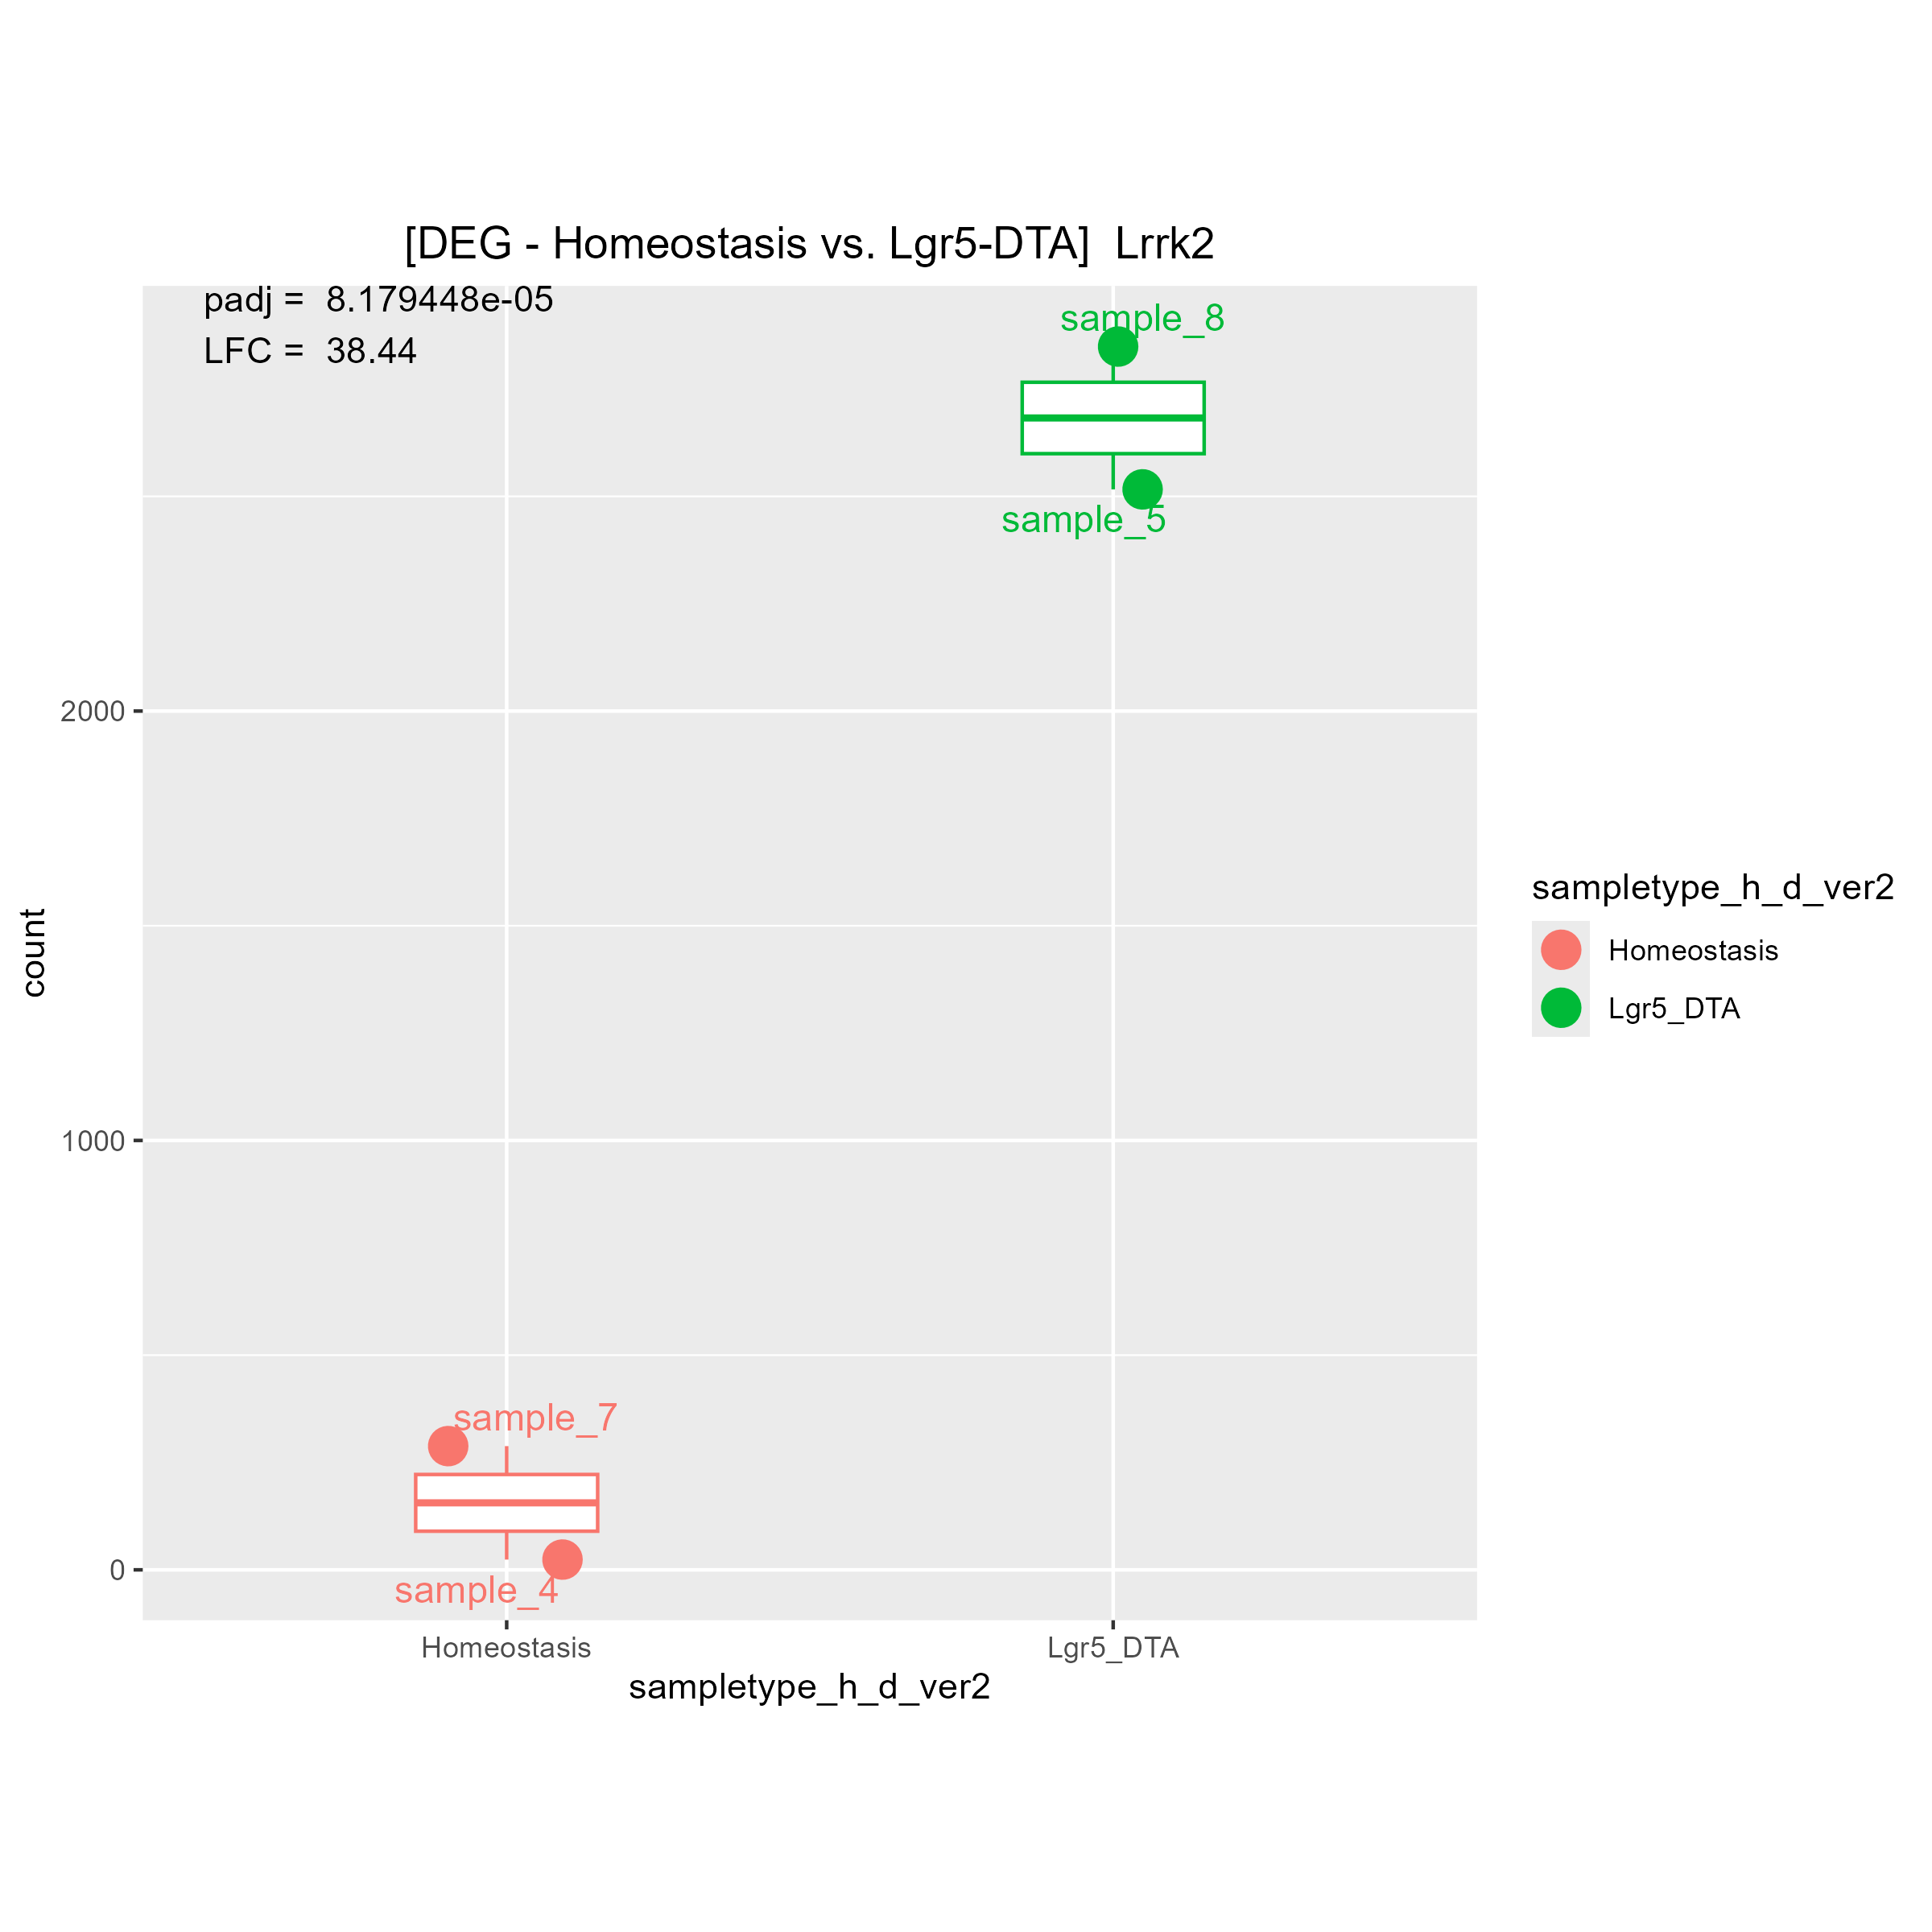
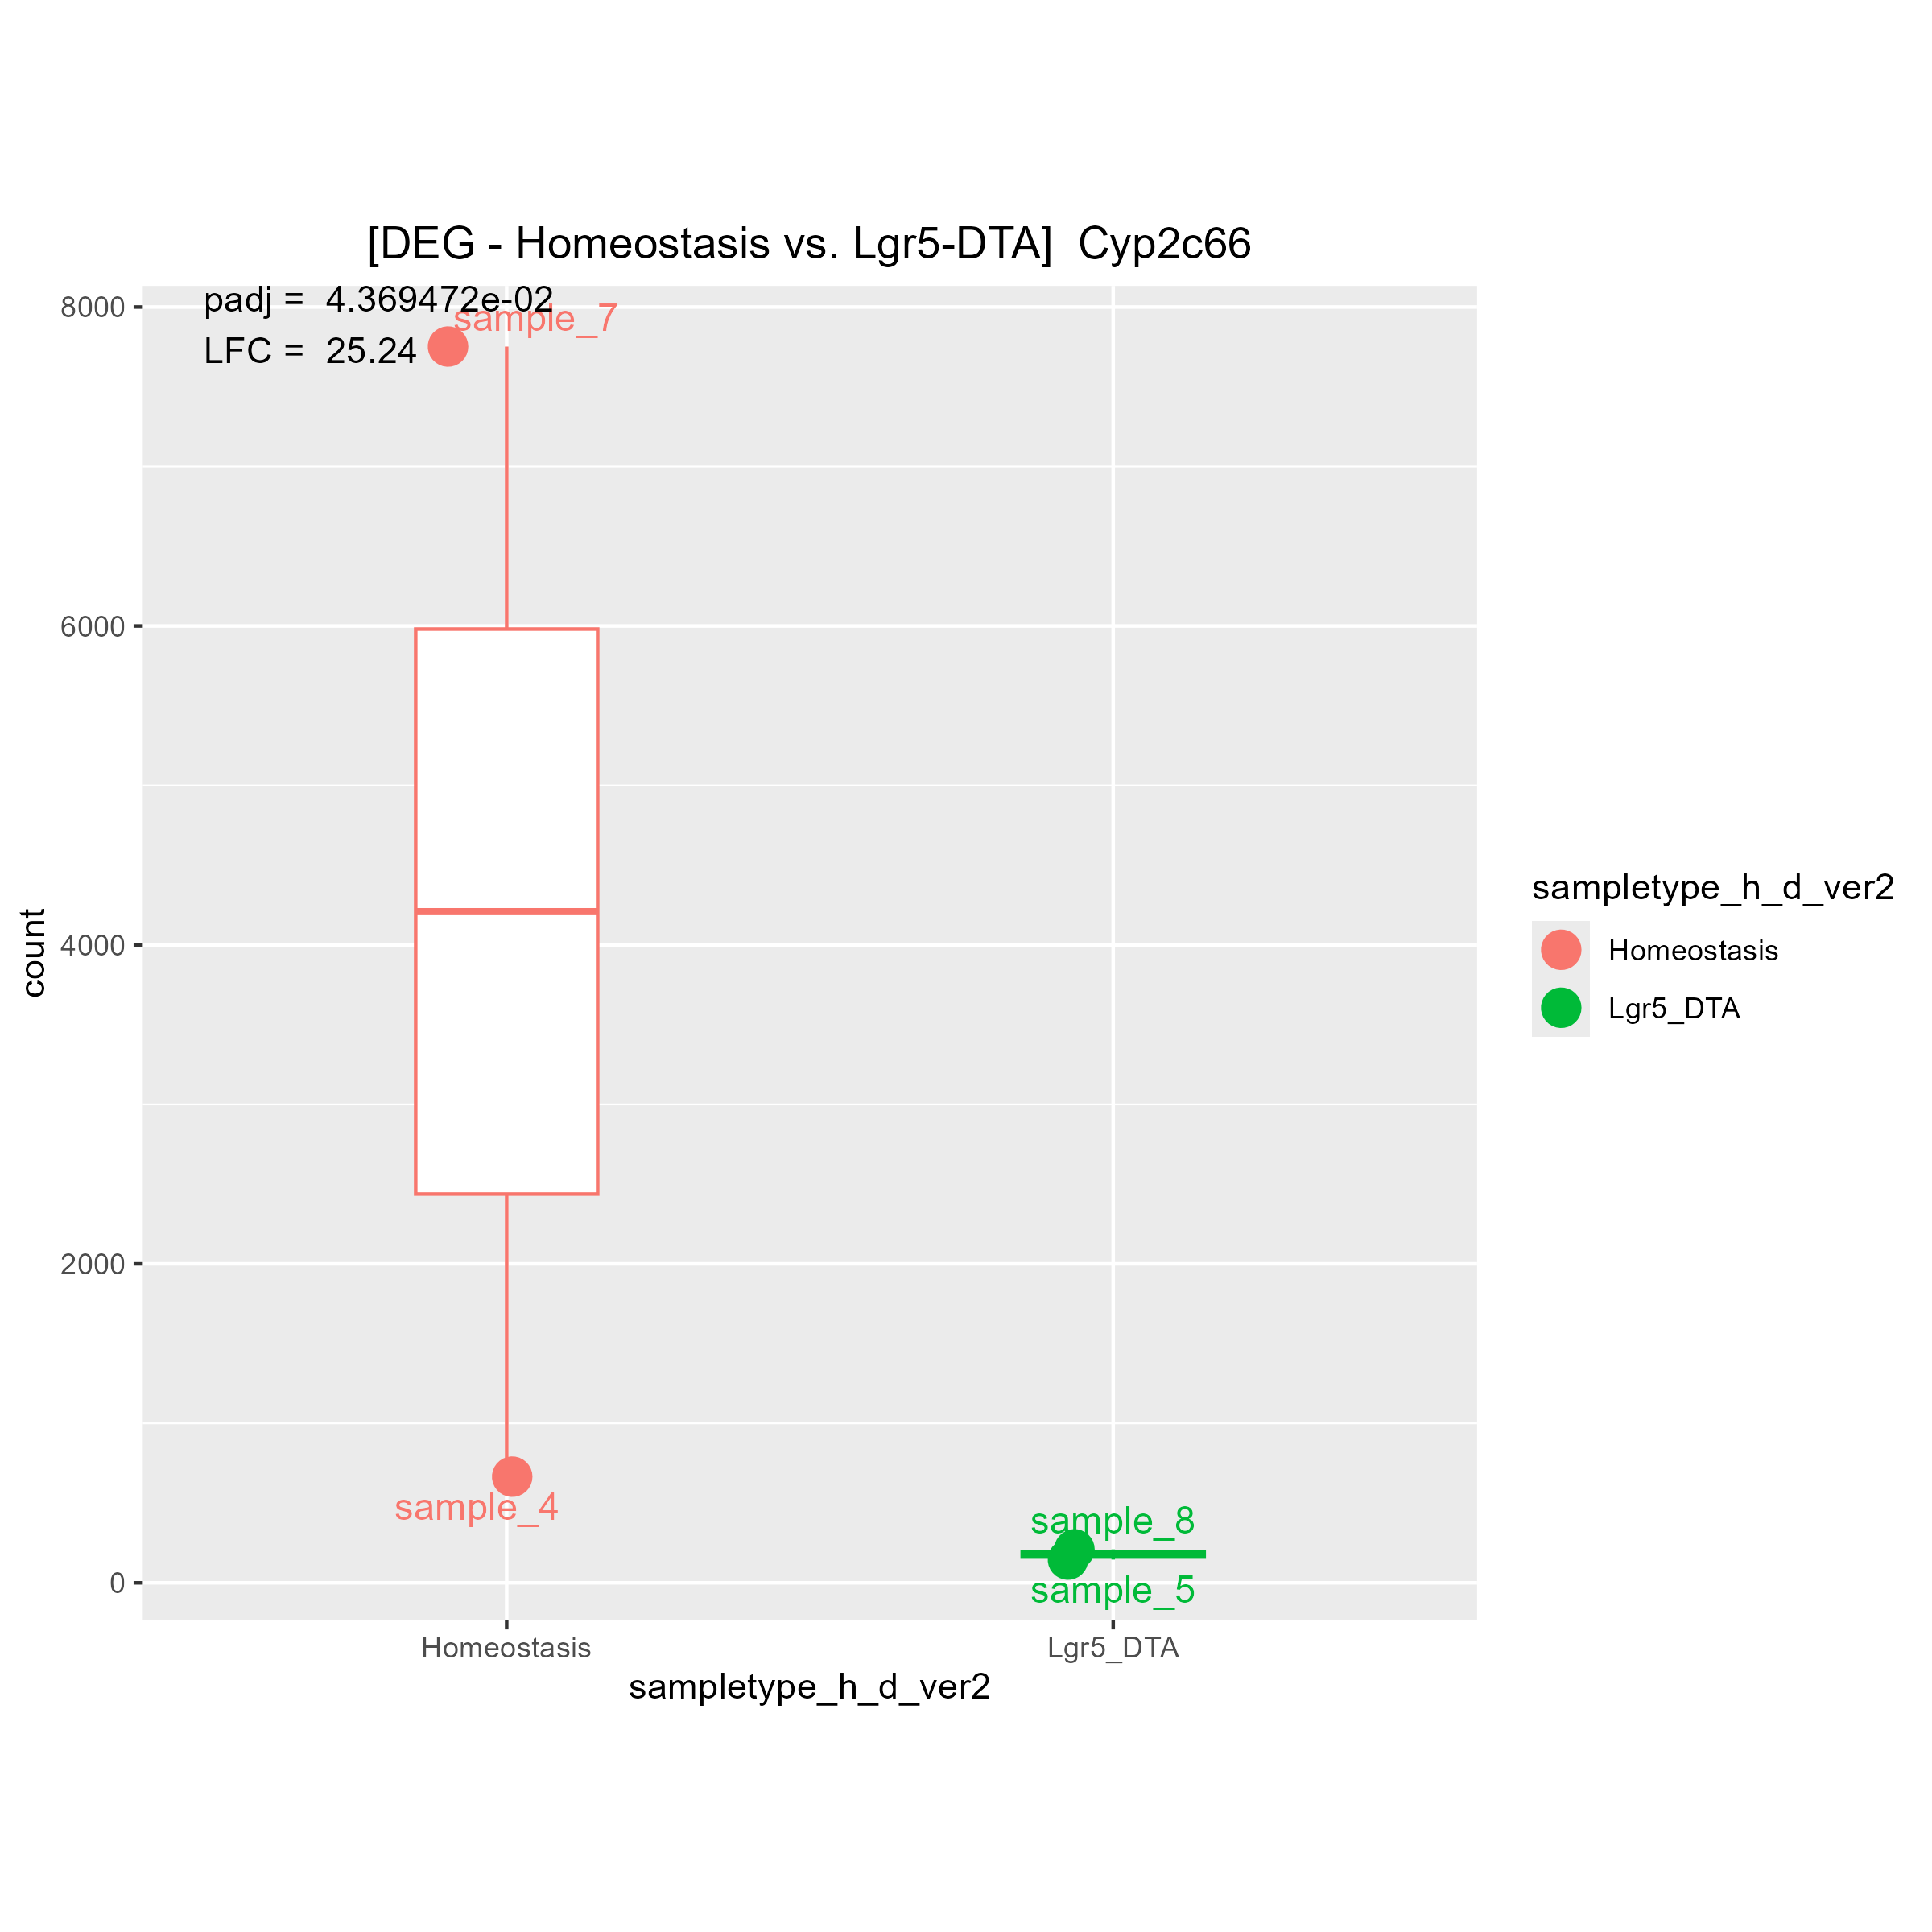
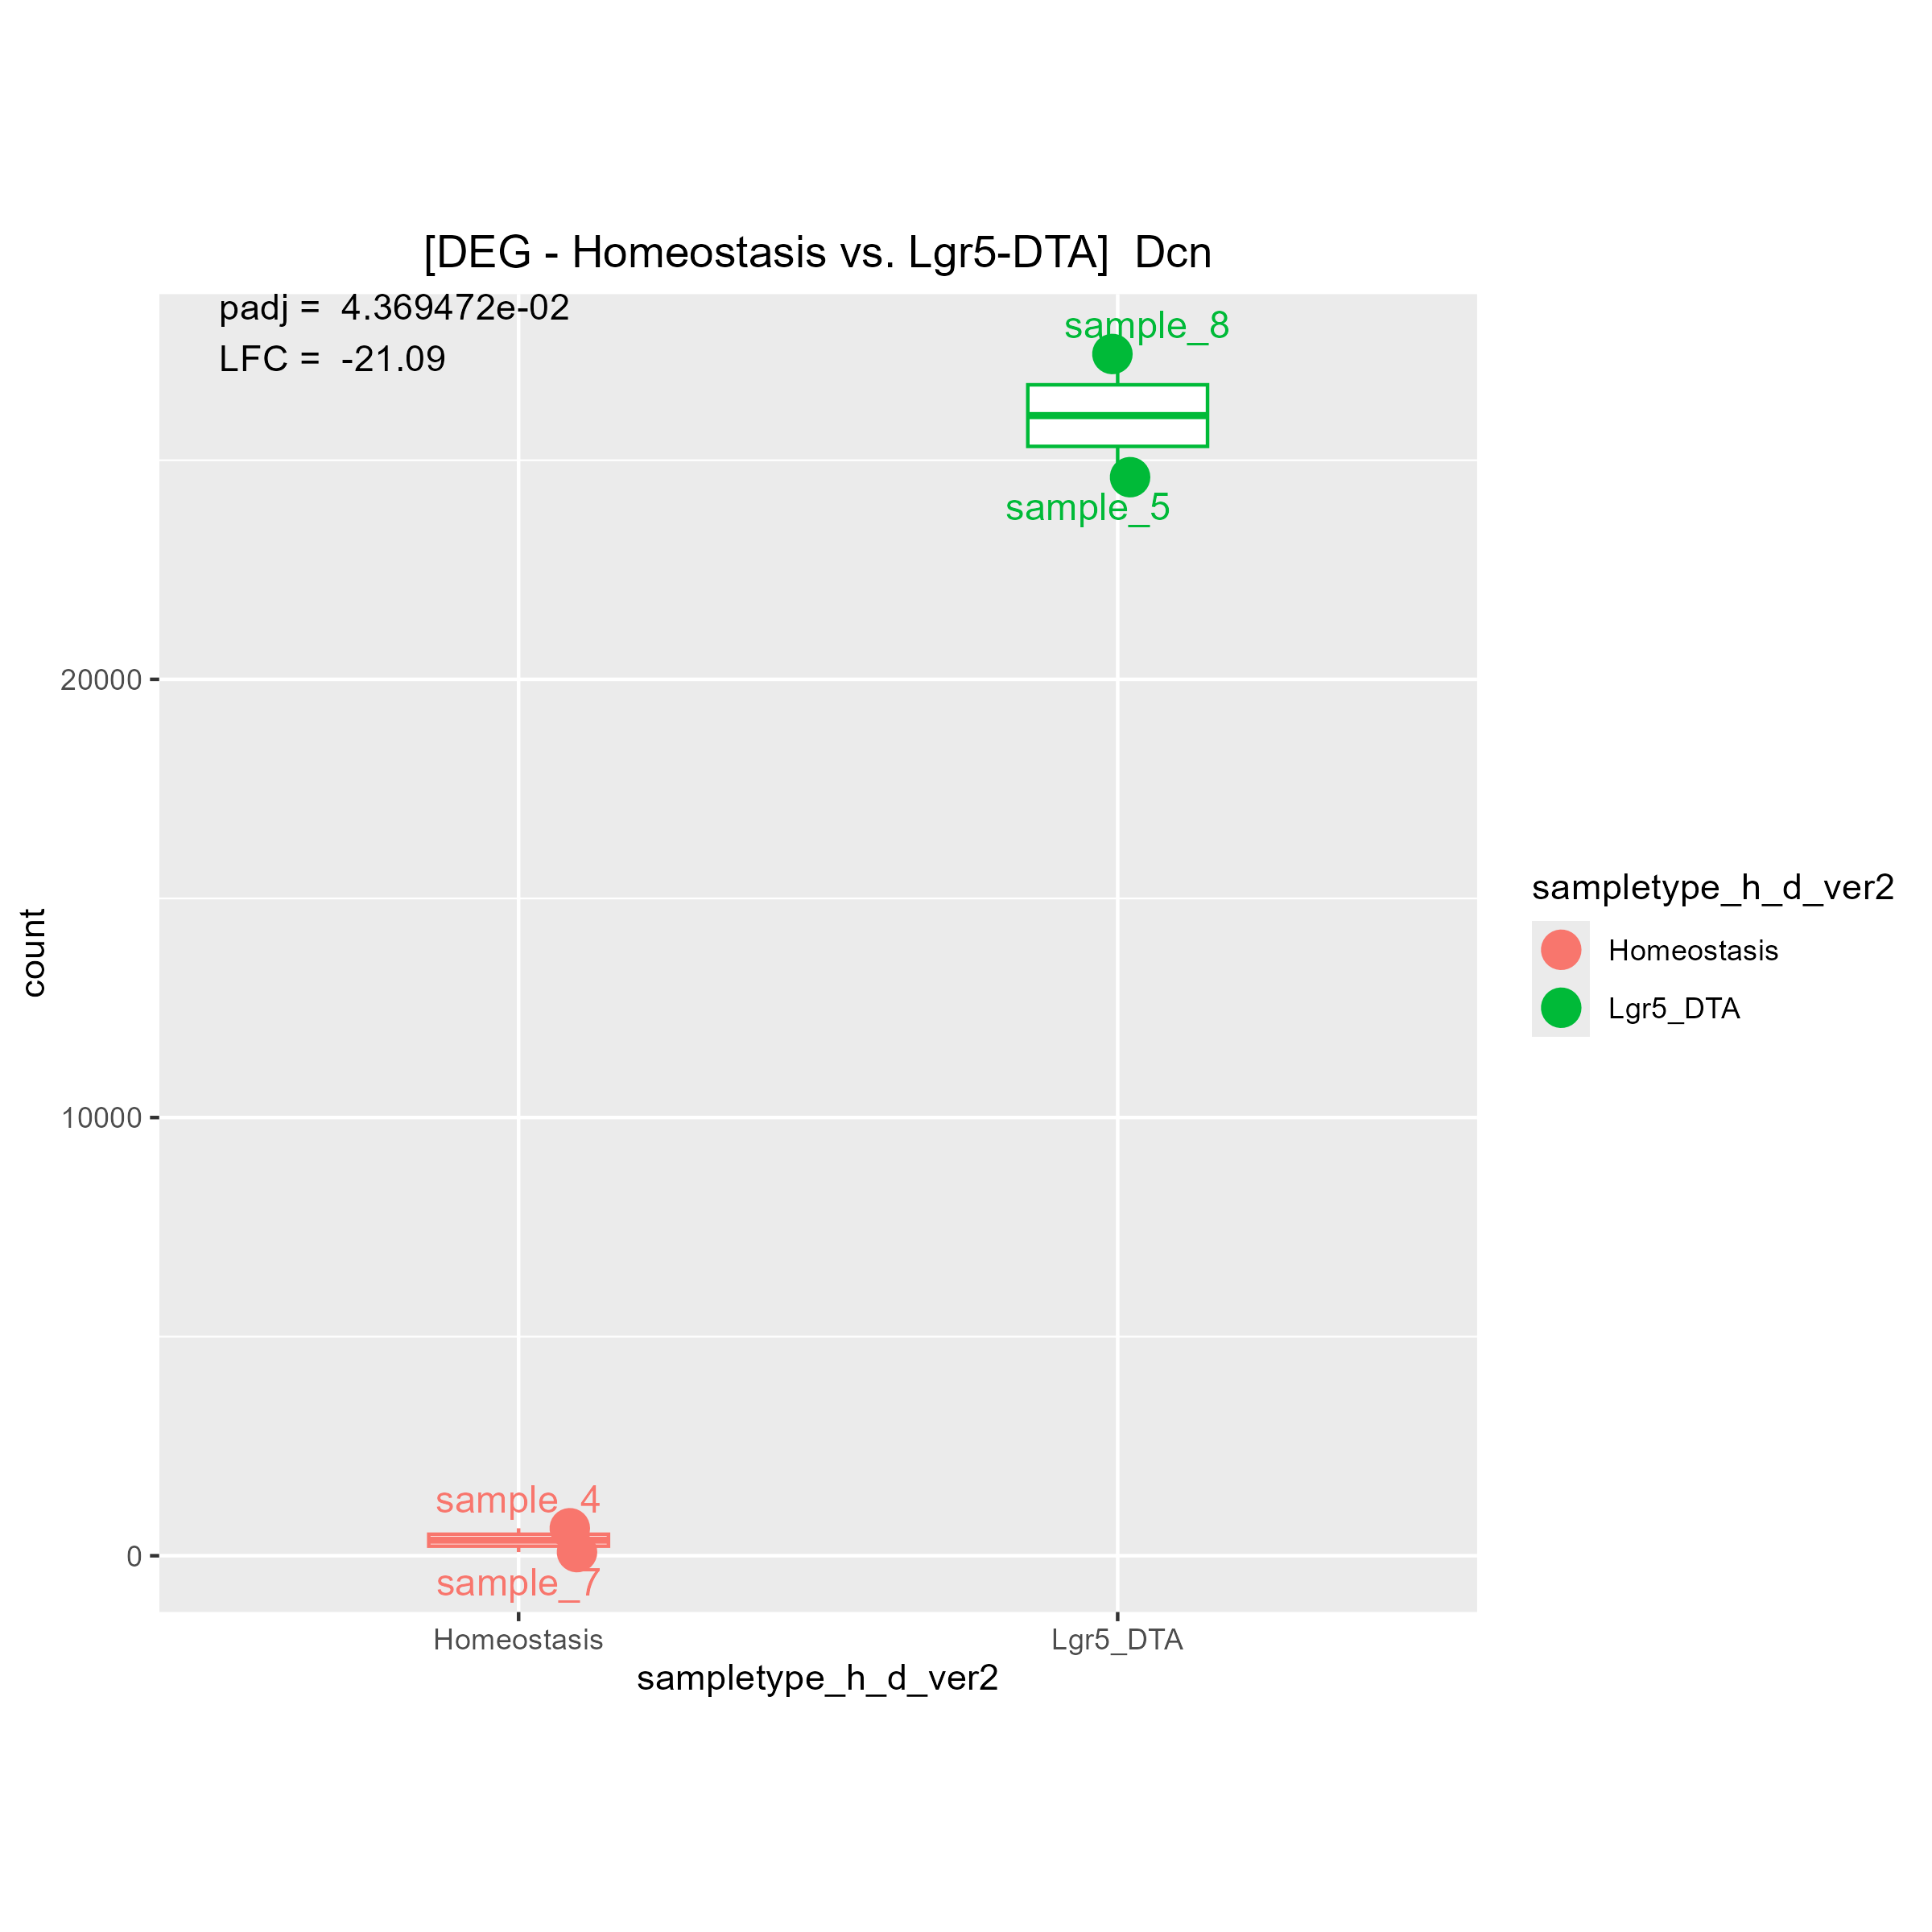
Although there are some strange count plots the sign of the LFC are wrong. I'll show you one good plot and two strange plots.
sessionInfo( )
> sessionInfo()
R version 4.3.2 (2023-10-31 ucrt)
Platform: x86_64-w64-mingw32/x64 (64-bit)
Running under: Windows 11 x64 (build 22631)

Matrix products: default


locale:
[1] LC_COLLATE=Korean_Korea.utf8  LC_CTYPE=Korean_Korea.utf8    LC_MONETARY=Korean_Korea.utf8
[4] LC_NUMERIC=C                  LC_TIME=Korean_Korea.utf8

time zone: Asia/Seoul
tzcode source: internal

attached base packages:
[1] stats4    stats     graphics  grDevices utils     datasets  methods   base

other attached packages:
 [1] EnhancedVolcano_1.20.0      lubridate_1.9.3             forcats_1.0.0               stringr_1.5.1
 [5] purrr_1.0.2                 readr_2.1.5                 tidyr_1.3.1                 tibble_3.2.1
 [9] tidyverse_2.0.0             patchwork_1.2.0             Seurat_5.0.3                SeuratObject_5.0.1
[13] sp_2.1-3                    sva_3.50.0                  genefilter_1.84.0           mgcv_1.9-0
[17] nlme_3.1-163                RUVSeq_1.36.0               pheatmap_1.0.12             dplyr_1.1.4
[21] ggrepel_0.9.5               DESeq2_1.42.0               ggplot2_3.5.0               EDASeq_2.36.0
[25] ShortRead_1.60.0            GenomicAlignments_1.38.2    SummarizedExperiment_1.32.0 MatrixGenerics_1.14.0
[29] matrixStats_1.2.0           Rsamtools_2.18.0            GenomicRanges_1.54.1        Biostrings_2.70.2
[33] GenomeInfoDb_1.38.8         XVector_0.42.0              IRanges_2.36.0              S4Vectors_0.40.2
[37] BiocParallel_1.36.0         Biobase_2.62.0              BiocGenerics_0.48.1         edgeR_4.0.16
[41] limma_3.58.1

loaded via a namespace (and not attached):
  [1] R.methodsS3_1.8.2       progress_1.2.3          urlchecker_1.0.1        goftest_1.2-3
  [5] vctrs_0.6.5             spatstat.random_3.2-3   digest_0.6.34           png_0.1-8
  [9] deldir_2.0-4            parallelly_1.37.1       renv_1.0.5              MASS_7.3-60
 [13] reshape2_1.4.4          httpuv_1.6.14           qvalue_2.34.0           withr_3.0.0
 [17] ggfun_0.1.4             ellipsis_0.3.2          survival_3.5-7          memoise_2.0.1
 [21] clusterProfiler_4.10.1  gson_0.1.0              profvis_0.3.8           systemfonts_1.0.6
 [25] ragg_1.3.0              tidytree_0.4.6          zoo_1.8-12              pbapply_1.7-2
 [29] R.oo_1.26.0             prettyunits_1.2.0       KEGGREST_1.42.0         promises_1.2.1
 [33] httr_1.4.7              restfulr_0.0.15         globals_0.16.3          fitdistrplus_1.1-11
 [37] rstudioapi_0.16.0       miniUI_0.1.1.1          generics_0.1.3          DOSE_3.28.2
 [41] curl_5.2.1              zlibbioc_1.48.0         ggraph_2.2.1            polyclip_1.10-6
 [45] GenomeInfoDbData_1.2.11 SparseArray_1.2.4       xtable_1.8-4            S4Arrays_1.2.0
 [49] BiocFileCache_2.10.2    hms_1.1.3               irlba_2.3.5.1           colorspace_2.1-0
 [53] filelock_1.0.3          ROCR_1.0-11             reticulate_1.35.0       spatstat.data_3.0-4
 [57] magrittr_2.0.3          lmtest_0.9-40           later_1.3.2             viridis_0.6.5
 [61] ggtree_3.10.1           lattice_0.21-9          spatstat.geom_3.2-9     future.apply_1.11.2
 [65] scattermore_1.2         XML_3.99-0.16.1         triebeard_0.4.1         shadowtext_0.1.3
 [69] cowplot_1.1.3           RcppAnnoy_0.0.22        pillar_1.9.0            compiler_4.3.2
 [73] RSpectra_0.16-1         stringi_1.8.3           tensor_1.5              devtools_2.4.5
 [77] genekitr_1.2.5          plyr_1.8.9              crayon_1.5.2            abind_1.4-5
 [81] BiocIO_1.12.0           gridGraphics_0.5-1      emdbook_1.3.13          locfit_1.5-9.8
 [85] graphlayouts_1.1.1      bit_4.0.5               geneset_0.2.7           fastmatch_1.1-4
 [89] textshaping_0.3.7       codetools_0.2-19        plotly_4.10.4           mime_0.12
 [93] splines_4.3.2           Rcpp_1.0.12             fastDummies_1.7.3       dbplyr_2.5.0
 [97] europepmc_0.4.3         HDO.db_0.99.1           interp_1.1-6            blob_1.2.4
[101] utf8_1.2.4              apeglm_1.24.0           fs_1.6.3                listenv_0.9.1
[105] pkgbuild_1.4.4          openxlsx_4.2.5.2        ggplotify_0.1.2         Matrix_1.6-5
[109] statmod_1.5.0           tzdb_0.4.0              tweenr_2.0.3            pkgconfig_2.0.3
[113] tools_4.3.2             cachem_1.0.8            RSQLite_2.3.5           viridisLite_0.4.2
[117] DBI_1.2.2               numDeriv_2016.8-1.1     fastmap_1.1.1           scales_1.3.0
[121] grid_4.3.2              usethis_2.2.3           ica_1.0-3               coda_0.19-4.1
[125] BiocManager_1.30.22     dotCall64_1.1-1         RANN_2.6.1              farver_2.1.1
[129] tidygraph_1.3.1         scatterpie_0.2.2        yaml_2.3.8              latticeExtra_0.6-30
[133] rtracklayer_1.62.0      cli_3.6.2               leiden_0.4.3.1          lifecycle_1.0.4
[137] uwot_0.1.16             mvtnorm_1.2-4           sessioninfo_1.2.2       annotate_1.80.0
[141] timechange_0.3.0        gtable_0.3.4            rjson_0.2.21            ggridges_0.5.6
[145] progressr_0.14.0        parallel_4.3.2          ape_5.7-1               jsonlite_1.8.8
[149] RcppHNSW_0.6.0          bitops_1.0-7            bit64_4.0.5             Rtsne_0.17
[153] yulab.utils_0.1.4       spatstat.utils_3.0-4    zip_2.3.1               urltools_1.7.3
[157] bdsmatrix_1.3-7         GOSemSim_2.28.1         R.utils_2.12.3          lazyeval_0.2.2
[161] shiny_1.8.1.1           htmltools_0.5.7         enrichplot_1.22.0       GO.db_3.18.0
[165] sctransform_0.4.1       rappdirs_0.3.3          glue_1.7.0              ggvenn_0.1.10
[169] spam_2.10-0             RCurl_1.98-1.14         treeio_1.26.0           jpeg_0.1-10
[173] gridExtra_2.3           igraph_2.0.3            R6_2.5.1                labeling_0.4.3
[177] GenomicFeatures_1.54.4  cluster_2.1.4           bbmle_1.0.25.1          pkgload_1.3.4
[181] aplot_0.2.2             DelayedArray_0.28.0     tidyselect_1.2.1        ggforce_0.4.2
[185] xml2_1.3.6              AnnotationDbi_1.64.1    future_1.33.2           munsell_0.5.1
[189] KernSmooth_2.23-22      data.table_1.15.2       htmlwidgets_1.6.4       aroma.light_3.32.0
[193] fgsea_1.28.0            RColorBrewer_1.1-3      hwriter_1.3.2.1         biomaRt_2.58.2
[197] rlang_1.1.3             spatstat.sparse_3.0-3   spatstat.explore_3.2-7  remotes_2.5.0
[201] ggnewscale_0.4.10       fansi_1.0.6

Thank you for your comment!
1)"Your contrast is comparing LGR5 to Homeostasis." means (Lgr5)/(Homeostasis). Is it right?
Then, I think if LGR5 has a higher expression level than Homeostasis, LFC must be positive.
If LGR5 has a lower expression level than Homeostasis, LFC must be negative.
May I ask why you said "The bottom 2 are fine, it's the top one that is wrong"?
2)I think there are no problem in those codes.
You will need to show some reproducible code for anybody to track this down. Please note that
DESeq2has been used by thousands of people (probably) millions of times, and to my knowledge nobody has ever reported that it randomly assigns logFC values that don't reflect the underlying differences. Because of that, it is far more likely that you have made a mistake somewhere, which nobody can diagnose just by looking at your code.Thank you for your comment!
I'll review my code from top to bottom.