Entering edit mode

I utilized the R package GEOquery to download data from the GEO database, followed by DFG analysis using the limma package. However, I am uncertain whether this process is accurate. The DFG output indicates that each P-value is significant, but each adjusted P-value tends towards 1. I attempted this process with several datasets using the limma R package and encountered the same outcome consistently. Thus, I suspect an error in my analysis code. Any assistance in resolving this issue would be greatly appreciated.
Here is my analysis code and its corresponding output:
options(stringsAsFactors = F)
suppressMessages(library(GEOquery))
library(stringr)
library(ggplot2)
library(reshape2)
library(limma)

gset <- getGEO('GSE98421', destdir=".", AnnotGPL = F, getGPL = F)
gse <- gset[[1]]
exp <- exprs(gse)

# Clinic data
meta.data <- pData(gse)
group_list <- sapply(meta.data$description, function(x)
    unlist(strsplit(x," "))[1])
group_list <- factor(group_list,levels = c("NL","PCOS"))
table(group_list)

# change ID names
gpl <- getGEO('GPL570', destdir=".")
probe.gene <- Table(gpl)[,c("ID","Gene Symbol")]
colnames(probe.gene) <- c("ID","Symbol")
probe.gene <- subset(probe.gene, Symbol != '')
ids <- probe.gene
ids$Symbol <- data.frame(sapply(ids$Symbol, function(x)
    unlist(strsplit(x,"///"))[1]), stringsAsFactors = F)[,1]
head(ids)

library(tidyverse)
exp <- as.data.frame(exp)
exp <- exp %>%
  mutate(ID = rownames(exp)) %>%
  inner_join(ids, by = "ID") %>%
  select(ID, Symbol, everything())

table(duplicated(exp$Symbol))
exp.unique <- avereps(exp[, -c(1,2)], ID = exp$Symbol)

#############################################################
# DFG analysis
design <- model.matrix(~0+factor(group_list))
colnames(design) <- levels(factor(group_list))
rownames(design) <- colnames(exp.unique)

fit <- lmFit(exp.unique, design)
contrast.matrix <- makeContrasts(paste0(c("NL","PCOS"), collapse = "-"), levels = design)
fit2 <- contrasts.fit(fit, contrast.matrix)
fit2 <- eBayes(fit2)
DiffEG <- topTable(fit2, coef=1, n=Inf) %>% na.omit()
head(DiffEG)
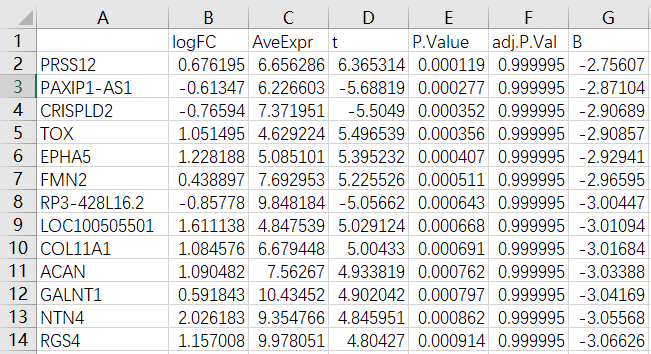

Thanks for your reply. I understand the principle of adjusted P-values, but I still want to address that issue. The description of the GSE98421 dataset indicates there are 120 differentially expressed genes in the analysis. So, I'm curious if there's an alternative method to analyze the array expression data.
The description of the analysis says there are 120 genes at a 1.5 fold change and a p<0.05. They don't mention any multiplicity correction. And if I analyze the data, I get the same results as you. I can't come up with 120 genes at a 1.5-fold difference and unadjusted p<0.05, but the data are apparently unpublished, so it's hard to say for sure what they actually did.