Entering edit mode

I am trying to perform differential RNA-Seq analysis from plasmodium species. I am using R command lines and I was trying to include the estimates of cell stages obtained from CIBERSORT deconvolution alongside batch effect estimate using RUVr.
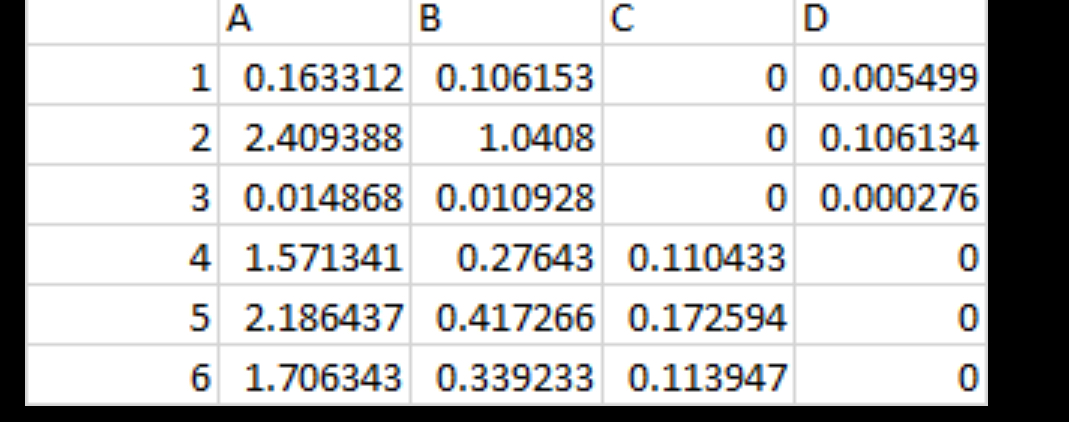
I managed to do the differential analysis with the code below just by including the batch effect estimate but I found a difficulty including the proportions in the table below to account for life stages differences
batch.effect <- genes_batch$W

design <- condition2design(condition = metatable_new$label,  batch.effect = batch.effect)
Below is the condition2desing function which I assume I would need to modify ?
condition2design <- function(condition,batch.effect=NULL){
   design.data <- data.frame(condition=condition)
   if(!is.null(batch.effect)){
     colnames(batch.effect) <- paste0('batch',1:ncol(batch.effect))
     design.data <- data.frame(design.data,batch.effect)   }
   design.fomula <- as.formula(paste0('~0+',paste0(colnames(design.data),collapse = '+')))
   design <- model.matrix(design.fomula, data=design.data)
   idx <- grep('condition',colnames(design))
   design.idx <- colnames(design)
   design.idx <- substr(design.idx,nchar('condition')+1,nchar(design.idx))
   colnames(design)[idx] <- design.idx[idx]   design }
Then I do the DE as follow
if(DE_pipeline == 'limma'){
##----->> limma pipeline
genes_3D_stat <- limma.pipeline(dge = genes_dge,
                                 design = design,
                                 deltaPS = NULL,
                                 contrast = contrast,
                                 diffAS = F,
                                 adjust.method = pval_adj_method)
}

if(DE_pipeline == 'glmQL'){
##----->> edgeR glmQL pipeline
genes_3D_stat <- edgeR.pipeline(dge = genes_dge,
                                 design = design,
                                 deltaPS = NULL,
                                 contrast = contrast,
                                 diffAS = F,
                                 method = 'glmQL',
                                 adjust.method = pval_adj_method)
}

if(DE_pipeline == 'glm'){
##----->> edgeR glm pipeline
genes_3D_stat <- edgeR.pipeline(dge = genes_dge,
                                 design = design,
                                 deltaPS = NULL,
                                 contrast = contrast,
                                 diffAS = F,
                                 method = 'glm',
                                 adjust.method = pval_adj_method)
}
Below are the different proportions for 4 life stages I am trying to fit into the model alongside the batch effect listed above
Your help is much appreciated

Cross-posted https://www.biostars.org/p/9596621/
It is hard to help because you are using functions that I am not familiar with. Where did you get the functions condition2design, limma.pipeline and edgeR.pipeline from? As far as I can tell, there are no Bioconductor packages than include functions by those names.
Many thanks for your help. These functions are part from the 3D RNA Seq pipeline
https://github.com/taffareltorres/ThreeDRNAseq_HuttonICS/tree/master/R
They are specifically listed under pipeline.R and conditin2design functions
And the entire command line and pipeline for the analysis is here
https://github.com/wyguo/ThreeDRNAseq/blob/master/command%20line.md
I managed to run the package but I had hard time modifying the code to fit my proportions and I would really appreciate your help.
I was wondering if I do
1)
batch.effect <- genes_batch$W + A + B+ C+ DThen continue the rest of analysis in the link above
2) Or I shall modify condition2desing function ? And how?
3) Or obtain the normalized counts from above the pipeline above then do :
Your help is much appreciated
You seem to be trying to combine CIBERSORT with ThreeDRNAseq. I'm not familiar with using either of those tools. You should perhaps ask the authors of those packages. There are papers on deconvolution analyses.
Many thanks for your reply.
Assuming I want to use limma only without any of those pipelines, would RNAseq counts alongside The variables observed in the table attached in the image and estimated batch work with this code ?
Is my design looks correct ?
Many thanks for your help
No, the design doesn't look correct to me. Cell-type proportions will affect expression in a linear fashion on the unlogged scale yet you are including them in an equation that is on the log-scale. That doesn't seem to me to be a useful thing to do.
I'm not actually even clear what hypothesis you are intending to test, i.e., what you are hoping to achieve by including the cell-type proportions in the model.
I can't advise you how to use CIBERSORT proportions. You could perhaps follow CIBERSORT advice regarding how they intend their proportions to be used.
Many thanks for your guidance.
I was trying to include those proportion in the model to remove any DE genes which are due to differences in cell stages (A,B,C,D) rather than treatment, the proportion of cell staging in each sample are estimated By CIBERSORT as seen in the attached table. In bioconductor granulator (https://www.bioconductor.org/packages/release/bioc/vignettes/granulator/inst/doc/granulator.html) package which similar to CIBERDORT and generate similar output (image attached below) the following is mentioned
For subsequent analysis, the estimated cell-type proportions can be now included in a linear model as covariates to account for cell type heterogeneity, or to impute cell-type specific gene expression profiles. ![Deconvolution output from granulator ]
Is there a way my model can be corrected based on this hypothesis ? Your help is much appreciated
As I've already said, I can't advise you how to use CIBERSORT proportions. I have already told you that the cell-type proportions don't really make sense in a limma linear model. I don't know any way to achieve what you want as a regular limma analysis.
Feel free to ask the granulator authors for more details about their advice and about exactly what sort of linear model they were refering to.
Thanks for your reply and your time.
BTW, you need to use markdown mark-up in order to post code on this forum. I have been editing/fixing each of your posts.
Apologies for that. Thanks for the note