Hi everyone,
I have a theoretical question related to results after p-value adjusting methodology.
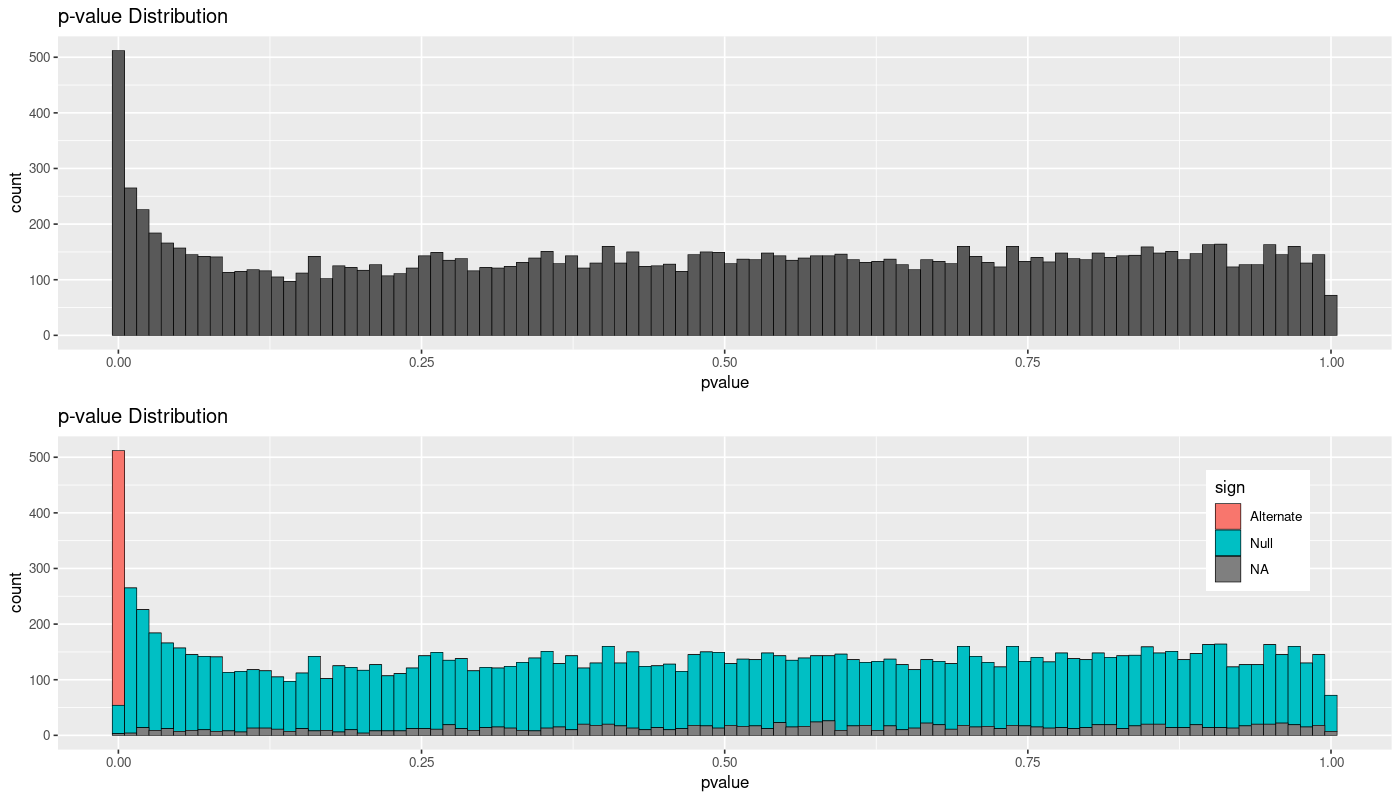
After a classical RNAseq experiment with one condition, processing counts (filtering small counts in at least half of the samples), normalizing the information, etc. I'm QCs the information, plotting the distribution of p-values of all the genes and then splitting then the information by the significance or not using a p-adj < 0.1. After reading some information on how to interpret the information here or here, I was expecting a threshold in the p-value that would more or less equal the Null hypothesis to the noise of the different p-values.
My questions are:
- Is it normal to obtain significant genes in all that have a p-value < 0.01 (first bar)? Shouldn't some noise be identified?
- Shouldn't some differentially expressed genes be identified in the first 4 or 5 bars that clearly should have some positives?
- Am I losing possible true positive results and should try with other methodologies/parameters?
Thanks in advance to all.
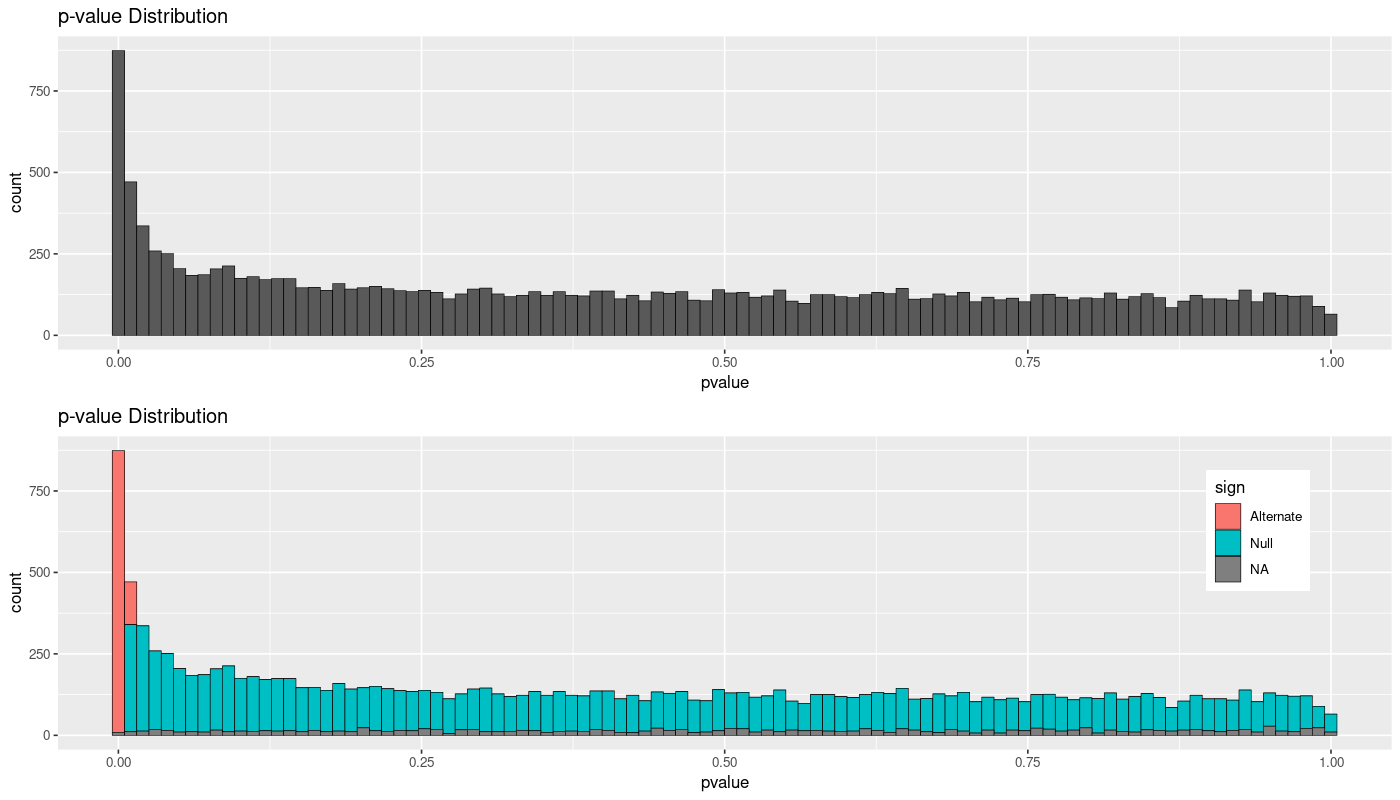
I have a different case, with more samples, and although the clusterisation in PCA was worse, there's still what seems to be a good pattern in the p-value distribution. But only the lower p-value are detected as significant: