
Hi,
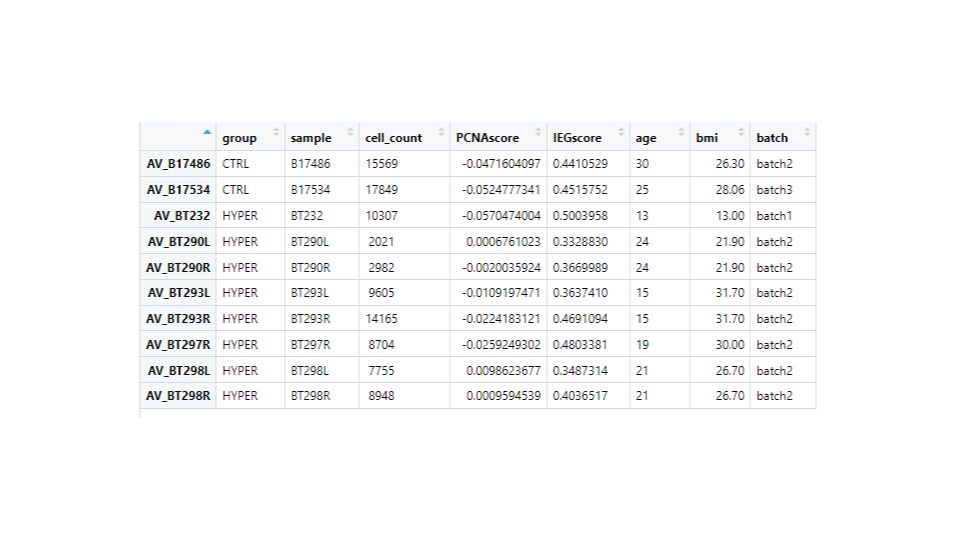
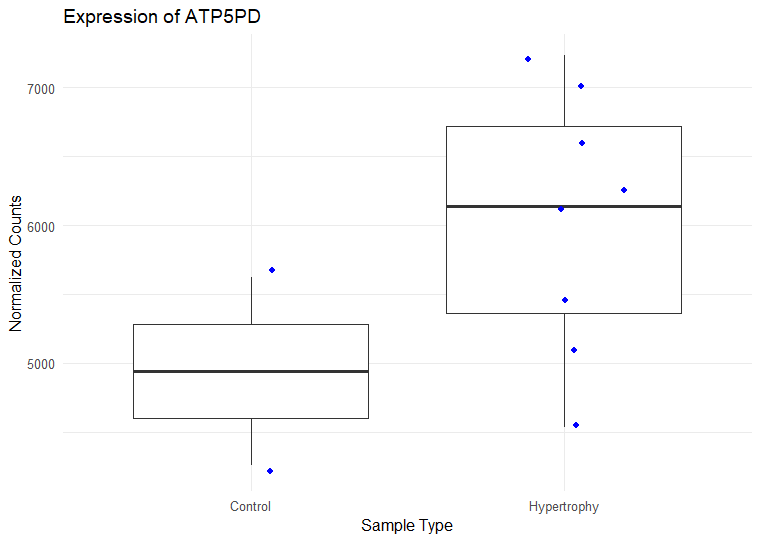
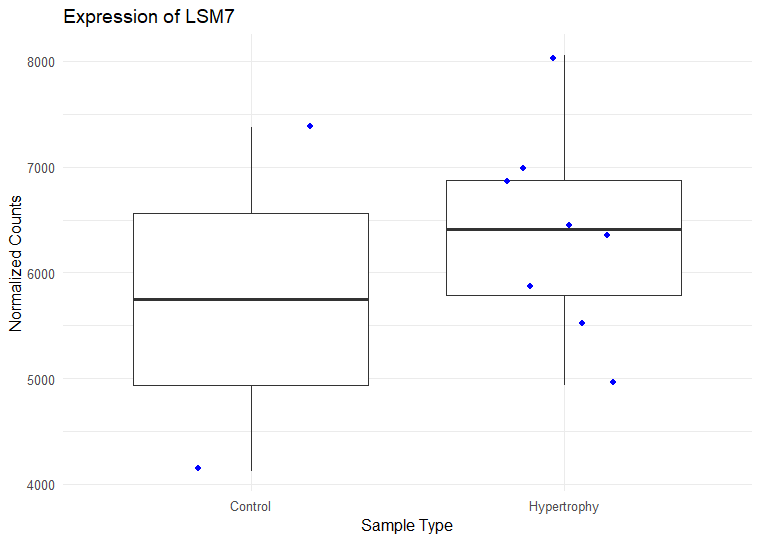
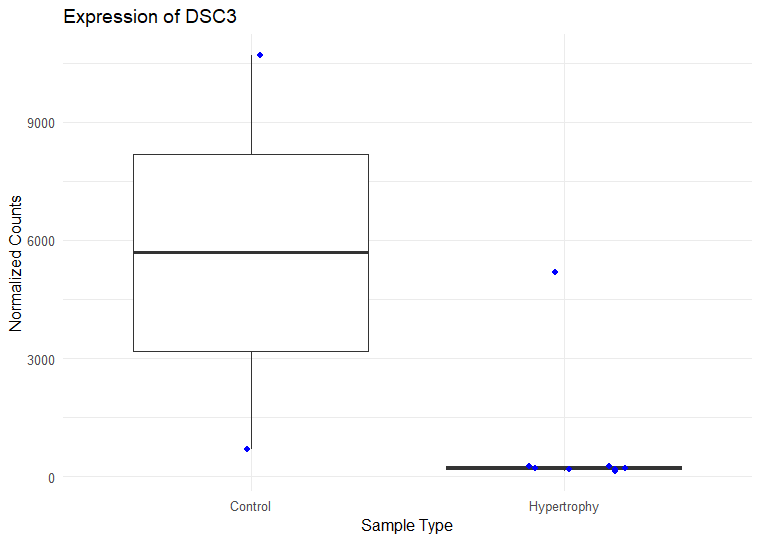
I have ran DESeq2 to get log2 fold changes of hypertrophy samples relative to control. (Added my code below). I think I am setting my contrast correct of Hypertrophy vs. control correctly while getting results. My log2 fold change results are mostly in concordance with what I observe in normalized counts. Meaning, for a gene, if the control samples have a lower mean than the hypertrophy samples, they show a positive log fold change and vice versa However, for some genes the results are conflicting. For example, The gene ATP5D is shown to have a negative log2 fold change of -0.48 but when I look at the normalized counts of the gene, the gene clearly has higher mean in the hypertrophy samples than the control (shown below). Or LSM7 has a negative log2 fold change of -0.5 while the normalized counts of Hypertrophy samples show a higher mean. On the other hand DSC3 has a negative log2 fold change of -2.13 and that can be observed in the normalized counts (shown below). Would appreciate any insight into why this might occur. I have also included a picture of my metadata.
 # Create DESeq2 object
  dds <- DESeqDataSetFromMatrix(counts,
                                colData = md,
                                design = ~PCNAscore + batch + group)


  # Run DESeq2 differential expression analysis
  dds <- DESeq(dds)

# Check the coefficients for the comparison
  resultsNames(dds)

  # Generate results object
  #res <- results(dds)
  res <- results(dds, contrast=c("group","HYPER","CTRL"), alpha = 0.05)

[1] "Intercept"              "PCNAscore"              "batch_batch2_vs_batch1" "batch_batch3_vs_batch1"
[5] "group_HYPER_vs_CTRL"

  # Shrink the log2 fold changes to be more appropriate using the apeglm method - should cite [paper]() when using this method
  res <- lfcShrink(dds,
                   coef = "group_HYPER_vs_CTRL",
                   res=res,
                   type = "apeglm")
  res_tbl <- res %>%
    data.frame() %>%
    rownames_to_column(var = "gene") %>%
    as_tibble() %>%
    arrange(padj)

sessionInfo( )

That makes sense. I am running iterations without any confounders, and with confounders to see how much of an effect each has. Appreciate your help.