
Hi,
Thanks for your attention.
I am trying to use voomLmFit to compare 3 phenotypes to the same control while also blocking for subject_ID that are repeatedly measured in batch 1 and batch2.
Experimental design
# print meta data
> pb.colData
         condition subject_ID_unique subject_ID batch
01501_b2       0_1          01501_b2      01501    b2
04901_b2       0_0          04901_b2      04901    b2
21201_b2       1_1          21201_b2      21201    b2
31101_b1       1_0          31101_b1      31101    b1
31101_b2       1_0          31101_b2      31101    b2
44501_b1       0_0          44501_b1      44501    b2
45401_b2       0_0          45401_b2      45401    b2
51301_b1       0_0          51301_b1      51301    b1
51801_b1       1_1          51801_b1      51801    b1
51801_b2       1_1          51801_b2      51801    b2
51901_b1       0_1          51901_b1      51901    b1
51901_b2       0_1          51901_b2      51901    b2
52001_b2       0_0          52001_b2      52001    b2
53201_b1       0_1          53201_b1      53201    b1
53201_b2       0_1          53201_b2      53201    b2
57001_b2       0_0          57001_b2      57001    b2
61101_b1       0_0          61101_b1      61101    b1
62001_b1       1_0          62001_b1      62001    b1
65301_b2       0_0          65301_b2      65301    b2
71301_b2       0_0          71301_b2      71301    b2
71501_b2       0_0          71501_b2      71501    b2
73801_b2       0_0          73801_b2      73801    b2
77601_b1       1_0          77601_b1      77601    b1
77601_b2       1_0          77601_b2      77601    b2
81001_b2       0_0          81001_b2      81001    b2
87501_b1       1_1          87501_b1      87501    b1
87501_b2       1_1          87501_b2      87501    b2
89201_b1       0_0          89201_b1      89201    b2
A9501_b2       0_0          A9501_b2      A9501    b2
The above table is my meta data where condition has four unique elements, with 0_0 being control and others being diseases. subject_ID is the identifier for every sample. batch is a factor I wish to regress out. subject_ID_unique is subject_ID plus batch to make a unique identifier.
Design matrix and code for running comparison
# condition & batch are factors with set levels
group <- pb.colData$condition
subject_ID <- pb.colData$subject_ID
batch <- pb.colData$batch

design <- model.matrix(~0+group+batch)

# dpb is a DGEList
v <- voomLmFit(counts = dpb,
                 design = design,
                 block = subject_ID,
                 sample.weights = TRUE)

# example contrast
contrast <- makeContrasts(group1_1 - group0_0, levels=colnames(design))

fit <- contrasts.fit(v, contrasts = contrast)
fit <- eBayes(fit)
If the above code makes sense to you (please correct, if not), by comparing 1_1 with 0_0, there were over 900 differentially expressed genes. However, it concerned me because I only have 3 unique samples in 1_1 group and the signals seem driven by outliers.
# print n unique samples per condition
>   print(pb.colData %>%
+           distinct(subject_ID, .keep_all = TRUE) %>% select(condition) %>% table())
condition
0_0 0_1 1_0 1_1
 14   3   3   3
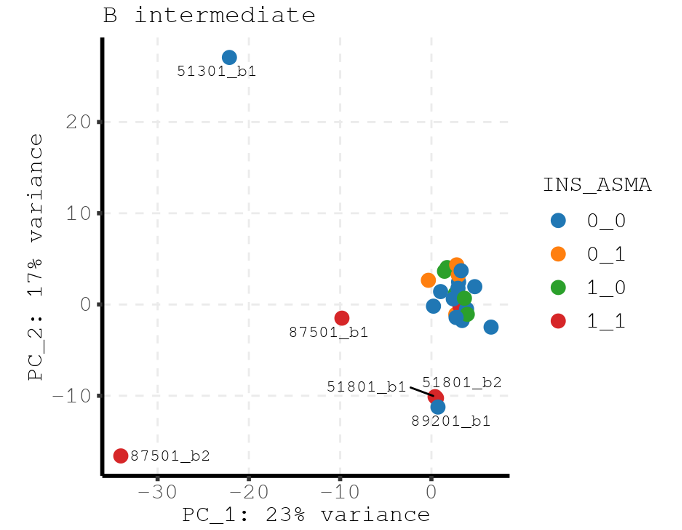
Here is the PCA for all samples where you can see the major variance is driven by outliers.
Question 1
How can I get a relatively robust result given the small sample size and outliers? I noticed eBayes has a robust argument. Can I use it? Is there any other methods worth trying?
========================
I am also trying to get the covariance matrix (diagonal and off diagonal) for using as an input for mashr. I read from the limma tutorial section 13.2:
The covariance matrix of the estimated Bhat is Sigma^2 CT (XT Vg X) -1C
Sorry about the format. The formula is on page 62
https://www.bioconductor.org/packages/devel/bioc/vignettes/limma/inst/doc/usersguide.pdf
Question 2
I understand X and C are design matrix and contrast matrix, but what is Vg? How to derive Vg?
Thank you very much for your time and help.
Jiacheng Ding

Thank you very much for your rapid response. Your answer makes a lot sense to me. I check the dimension reduction plot again using
limma::plotMDSwith the following code:It's indeed different from the original PCA plot I provided.
==========
Thanks for your explanation on Vg, however I still don't understand how to get the block correlation. Could you please provide more details on instructing me to calculate it? Thank you very much for your time!
Jiacheng Ding
I have edited my answer above to add code for Vg.
Thank you very very much for your time, professor!
Jiacheng
Your MDS plot is better than before, but you are still not following the recommendation for making for making such plots given in the limma and edgeR documentation. If
dpbis matrix of counts, then we recommend that you use:If
dpbis a DGEList object, then you could usedirectly, which will give the same result. We don't recommend that you use
plotMDS()on thevoom()output becausevoom()output is only intended to be used in functions that can use weights andplotMDS()doesn't use the weights.By the way, you never need to run
voom()aftervoomLmFit()because the output is already stored in thev$EListcomponent of thevoomLmFit()output. You could find that out by reading thevoomLmFithelp page.Thanks a lot for your answer again!
I am trying to validate the solution you provided by comparing the
sqrt(diag(CT (XT Vg X) -1 C))withfit$stdev.unscaled. Based on limma tutorial, they are supposed to be equal.https://www.bioconductor.org/packages/devel/bioc/vignettes/limma/inst/doc/usersguide.pdf page 62
R Code for calculating first gene's stdev.unscaled
My question
I think my way for getting 'weights' is wrong considering
stdev.unscaled.calculateddoes not equal tofit$stdev.unscaled[1,]. I understand I can usefit$stdev.unscaled[1,]to back calculateweightswith your solution, however, how to correctly get theweightsforv?Thank you very much!
Jiacheng Ding
The weights are contained in
v$EList$weights. I previously mistyped it asv$weightsbut have now corrected the code in my answer above.Here is an reproducible example of computing the covariance matrix:
In the above example, the covariance matrix agrees exactly with
fit$stdev.unscaled. Beware though that, if you usecontrasts.fit, then you will not be able to reproducefit$stdev.unscaledexactly for the reason explained on thecontrasts.fithelp page.Thank you very much, professor! It worked for my data.
Thank you for your time. Jiacheng