Entering edit mode

I have a very simple question regarding the dba.plotProfile function in Diffbind. I couldn't find an answer online, but would appreciate someone linking the answer, if it already exists somewhere.
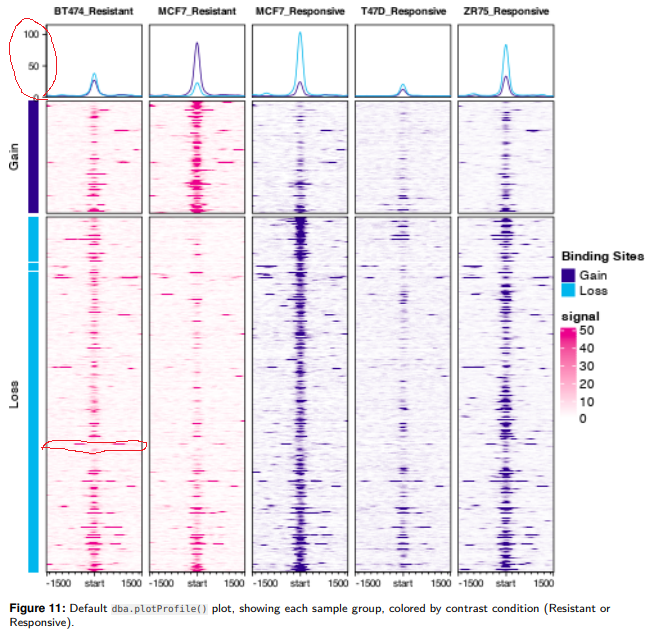
I'm generating multiple plot profiles (using dba.plotprofile), and would like the top graphs to all have the same y-axis range (so that I can put them side by side easily). Is there a way to adjust this each time I run the function? Attaching an image with the graphs I'm referring to circled.
Thank you in advance.