Hello,
We have been exploring using glmGamPoi via DESeq2 to model pseudobulk data, but we came across at least one dataset for which independent filtering seems to be a bit harsh. As background on the data, the matrix is rather sparse, and the contrast is imbalanced
> sum(ful_mat_flt == 0)/(nrow(ful_mat_flt)*ncol(ful_mat_flt))
# [1] 0.5377231
> table(col_data$deseq_contrast)
#  0  1
# 53  5
We perform the analysis as follows, and make two different results for including or excluding independent filtering and Cook's cutoff from the analysis:
ful_dds <- DESeqDataSetFromMatrix(countData=t(ful_mat_flt), colData=col_data, design=~deseq_contrast)
ful_ggp_dds <- DESeq(ful_dds, fitType="glmGamPoi", test="LRT", reduced=~1)
ful_ggp_unf <- results(ful_ggp_dds, independentFiltering = F, cooksCutoff = F)
ful_ggp_flt <- results(ful_ggp_dds)
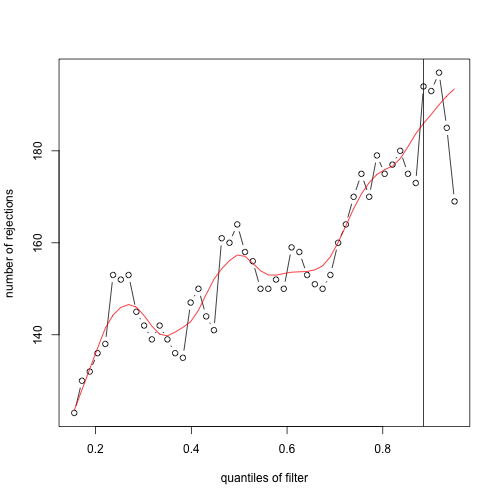
There is a pretty stark reduction in number of reported q-values:
> length(na.omit(ful_ggp_unf$padj))
[1] 16629
> length(na.omit(ful_ggp_flt$padj))
[1] 2262
plot(metadata(ful_ggp_flt)$filterNumRej, type="b", ylab="number of rejections",xlab="quantiles of filter")
lines(metadata(ful_ggp_flt)$lo.fit, col="red")
abline(v=metadata(ful_ggp_flt)$filterTheta)
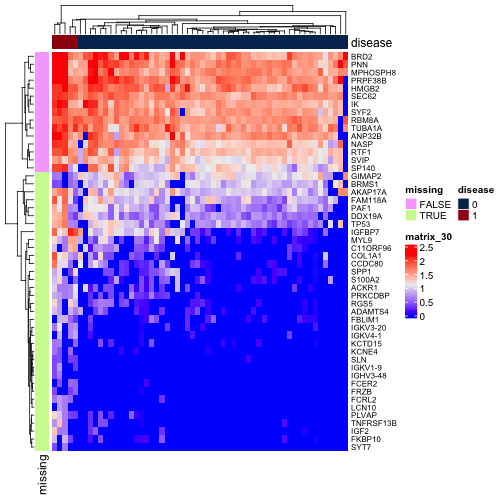
But also many of these q-values would have been high-ranking genes. One might argue that there is a reasonable amount of signal between the two subcohorts for these genes. Below is a heatmap of log10 DESeq2-normalized counts of top 50 genes by q-value when independent filtering is not applied. I've annotated the genes that were not included in the independent filtering results.
While there certainly is a difference in mean expression between the filtered and unfiltered genes, the base mean may be low in many cases just because of the imbalance of the cohorts and the sparsity of the matrix.
Is there a general recommendation for this sort of data set to 1) take advantage of independent filtering but 2) avoid what seems here like loss of sensitivity to true differential expression?
Thank you!
> sessionInfo()
R version 4.4.0 (2024-04-24)
Platform: aarch64-apple-darwin23.2.0
Running under: macOS Sonoma 14.5

Matrix products: default
BLAS:   /System/Library/Frameworks/Accelerate.framework/Versions/A/Frameworks/vecLib.framework/Versions/A/libBLAS.dylib
LAPACK: /Users/rzimmermann/.brew/Cellar/r/4.4.0_1/lib/R/lib/libRlapack.dylib;  LAPACK version 3.12.0

locale:
[1] en_US.UTF-8/en_US.UTF-8/en_US.UTF-8/C/en_US.UTF-8/en_US.UTF-8

time zone: America/New_York
tzcode source: internal

attached base packages:
[1] tools     stats4    stats     graphics  grDevices utils     datasets  methods   base

other attached packages:
 [1] glmGamPoi_1.17.4            arrow_16.1.0                GSA_1.03.3                  impute_1.78.0               plyr_1.8.9                  RColorBrewer_1.1-3          multtest_2.60.0             DESeq2_1.44.0
 [9] SummarizedExperiment_1.34.0 Biobase_2.64.0              MatrixGenerics_1.16.0       matrixStats_1.3.0           GenomicRanges_1.56.1        GenomeInfoDb_1.40.1         IRanges_2.38.1              S4Vectors_0.42.1
[17] BiocGenerics_0.50.0         limma_3.60.2

loaded via a namespace (and not attached):
  [1] gridExtra_2.3             remotes_2.5.0             rematch2_2.1.2            rlang_1.1.4               magrittr_2.0.3            clue_0.3-65               GetoptLong_1.0.5          compiler_4.4.0
  [9] DelayedMatrixStats_1.26.0 callr_3.7.6               png_0.1-8                 systemfonts_1.1.0         vctrs_0.6.5               stringr_1.5.1             shape_1.4.6.1             pkgconfig_2.0.3
 [17] crayon_1.5.3              backports_1.5.0           magick_2.8.4              XVector_0.44.0            labeling_0.4.3            utf8_1.2.4                tzdb_0.4.0                ps_1.7.6
 [25] UCSC.utils_1.0.0          ragg_1.3.2                UpSetR_1.4.0              purrr_1.0.2               bit_4.0.5                 waldo_0.5.2               zlibbioc_1.50.0           jsonlite_1.8.8
 [33] progress_1.2.3            DelayedArray_0.30.1       BiocParallel_1.38.0       broom_1.0.6               cluster_2.1.6             parallel_4.4.0            prettyunits_1.2.0         R6_2.5.1
 [41] stringi_1.8.4             GGally_2.2.1              car_3.1-2                 pkgload_1.3.4             iterators_1.0.14          Rcpp_1.0.13               assertthat_0.2.1          readr_2.1.5
 [49] Metrics_0.1.4             Matrix_1.7-0              splines_4.4.0             tidyselect_1.2.1          rstudioapi_0.16.0         abind_1.4-5               doParallel_1.0.17         codetools_0.2-20
 [57] processx_3.8.4            curl_5.2.1                pkgbuild_1.4.4            lattice_0.22-6            tibble_3.2.1              withr_3.0.0               desc_1.4.3                survival_3.7-0
 [65] ggstats_0.6.0             circlize_0.4.16           ggpubr_0.6.0              pillar_1.9.0              BiocManager_1.30.23       carData_3.0-5             foreach_1.5.2             generics_0.1.3
 [73] vroom_1.6.5               hms_1.1.3                 ggplot2_3.5.1             sparseMatrixStats_1.16.0  munsell_0.5.1             scales_1.3.0              glue_1.7.0                diffobj_0.3.5
 [81] ggsignif_0.6.4            locfit_1.5-9.9            grid_4.4.0                tidyr_1.3.1               colorspace_2.1-0          GenomeInfoDbData_1.2.12   patchwork_1.2.0           cli_3.6.3
 [89] textshaping_0.4.0         fansi_1.0.6               S4Arrays_1.4.1            ComplexHeatmap_2.20.0     dplyr_1.1.4               gtable_0.3.5              rstatix_0.7.2             EnhancedVolcano_1.22.0
 [97] digest_0.6.35             SparseArray_1.4.8         ggrepel_0.9.5             rjson_0.2.21              farver_2.1.2              lifecycle_1.0.4           httr_1.4.7                GlobalOptions_0.1.2
[105] statmod_1.5.0             bit64_4.0.5               MASS_7.3-60.2


Thanks for the idea. We had not tried this previously. Both theoretically and superficially I think this is improving things. When I use ihw, the number of rejections is substantially decreased:
Also our "true positives" are included in these rejections.
What's a little concerning though is that the interpolation of the base mean is not very smooth, since we have sparse data:
Also the effective decision boundary seems to change quite a bit depending on the group:
Are there any recommendations for modifying the covariate in this case to bin these data more evenly? I couldn't find anything in the documentation about this.
Thanks for your help!
I'm not one of the IHW developers, but I can forward the question.
Thanks! I would appreciate it!