Entering edit mode

I am attempting to run DESeq2, edgeR, and limma-voom to find DEGs between a condition sensitivity with factors 'lineage'. My samples are not really technical or biological replicates, but different cell lines in about 6 lineages.
My dispersion model doesn't seem to fit well to my data, but I wanted to check if it was acceptable, here is my code:
keep <- edgeR::filterByExpr(y = counts, group = sensitivity) # default filterByExpr settings
counts <- counts[keep, ]
dds <- DESeqDataSetFromMatrix(counts, metadata, design = ~ lineage + sensitivity)
dds <- DESeq(dds, fitType = fit_type, minReplicatesForReplace = Inf)
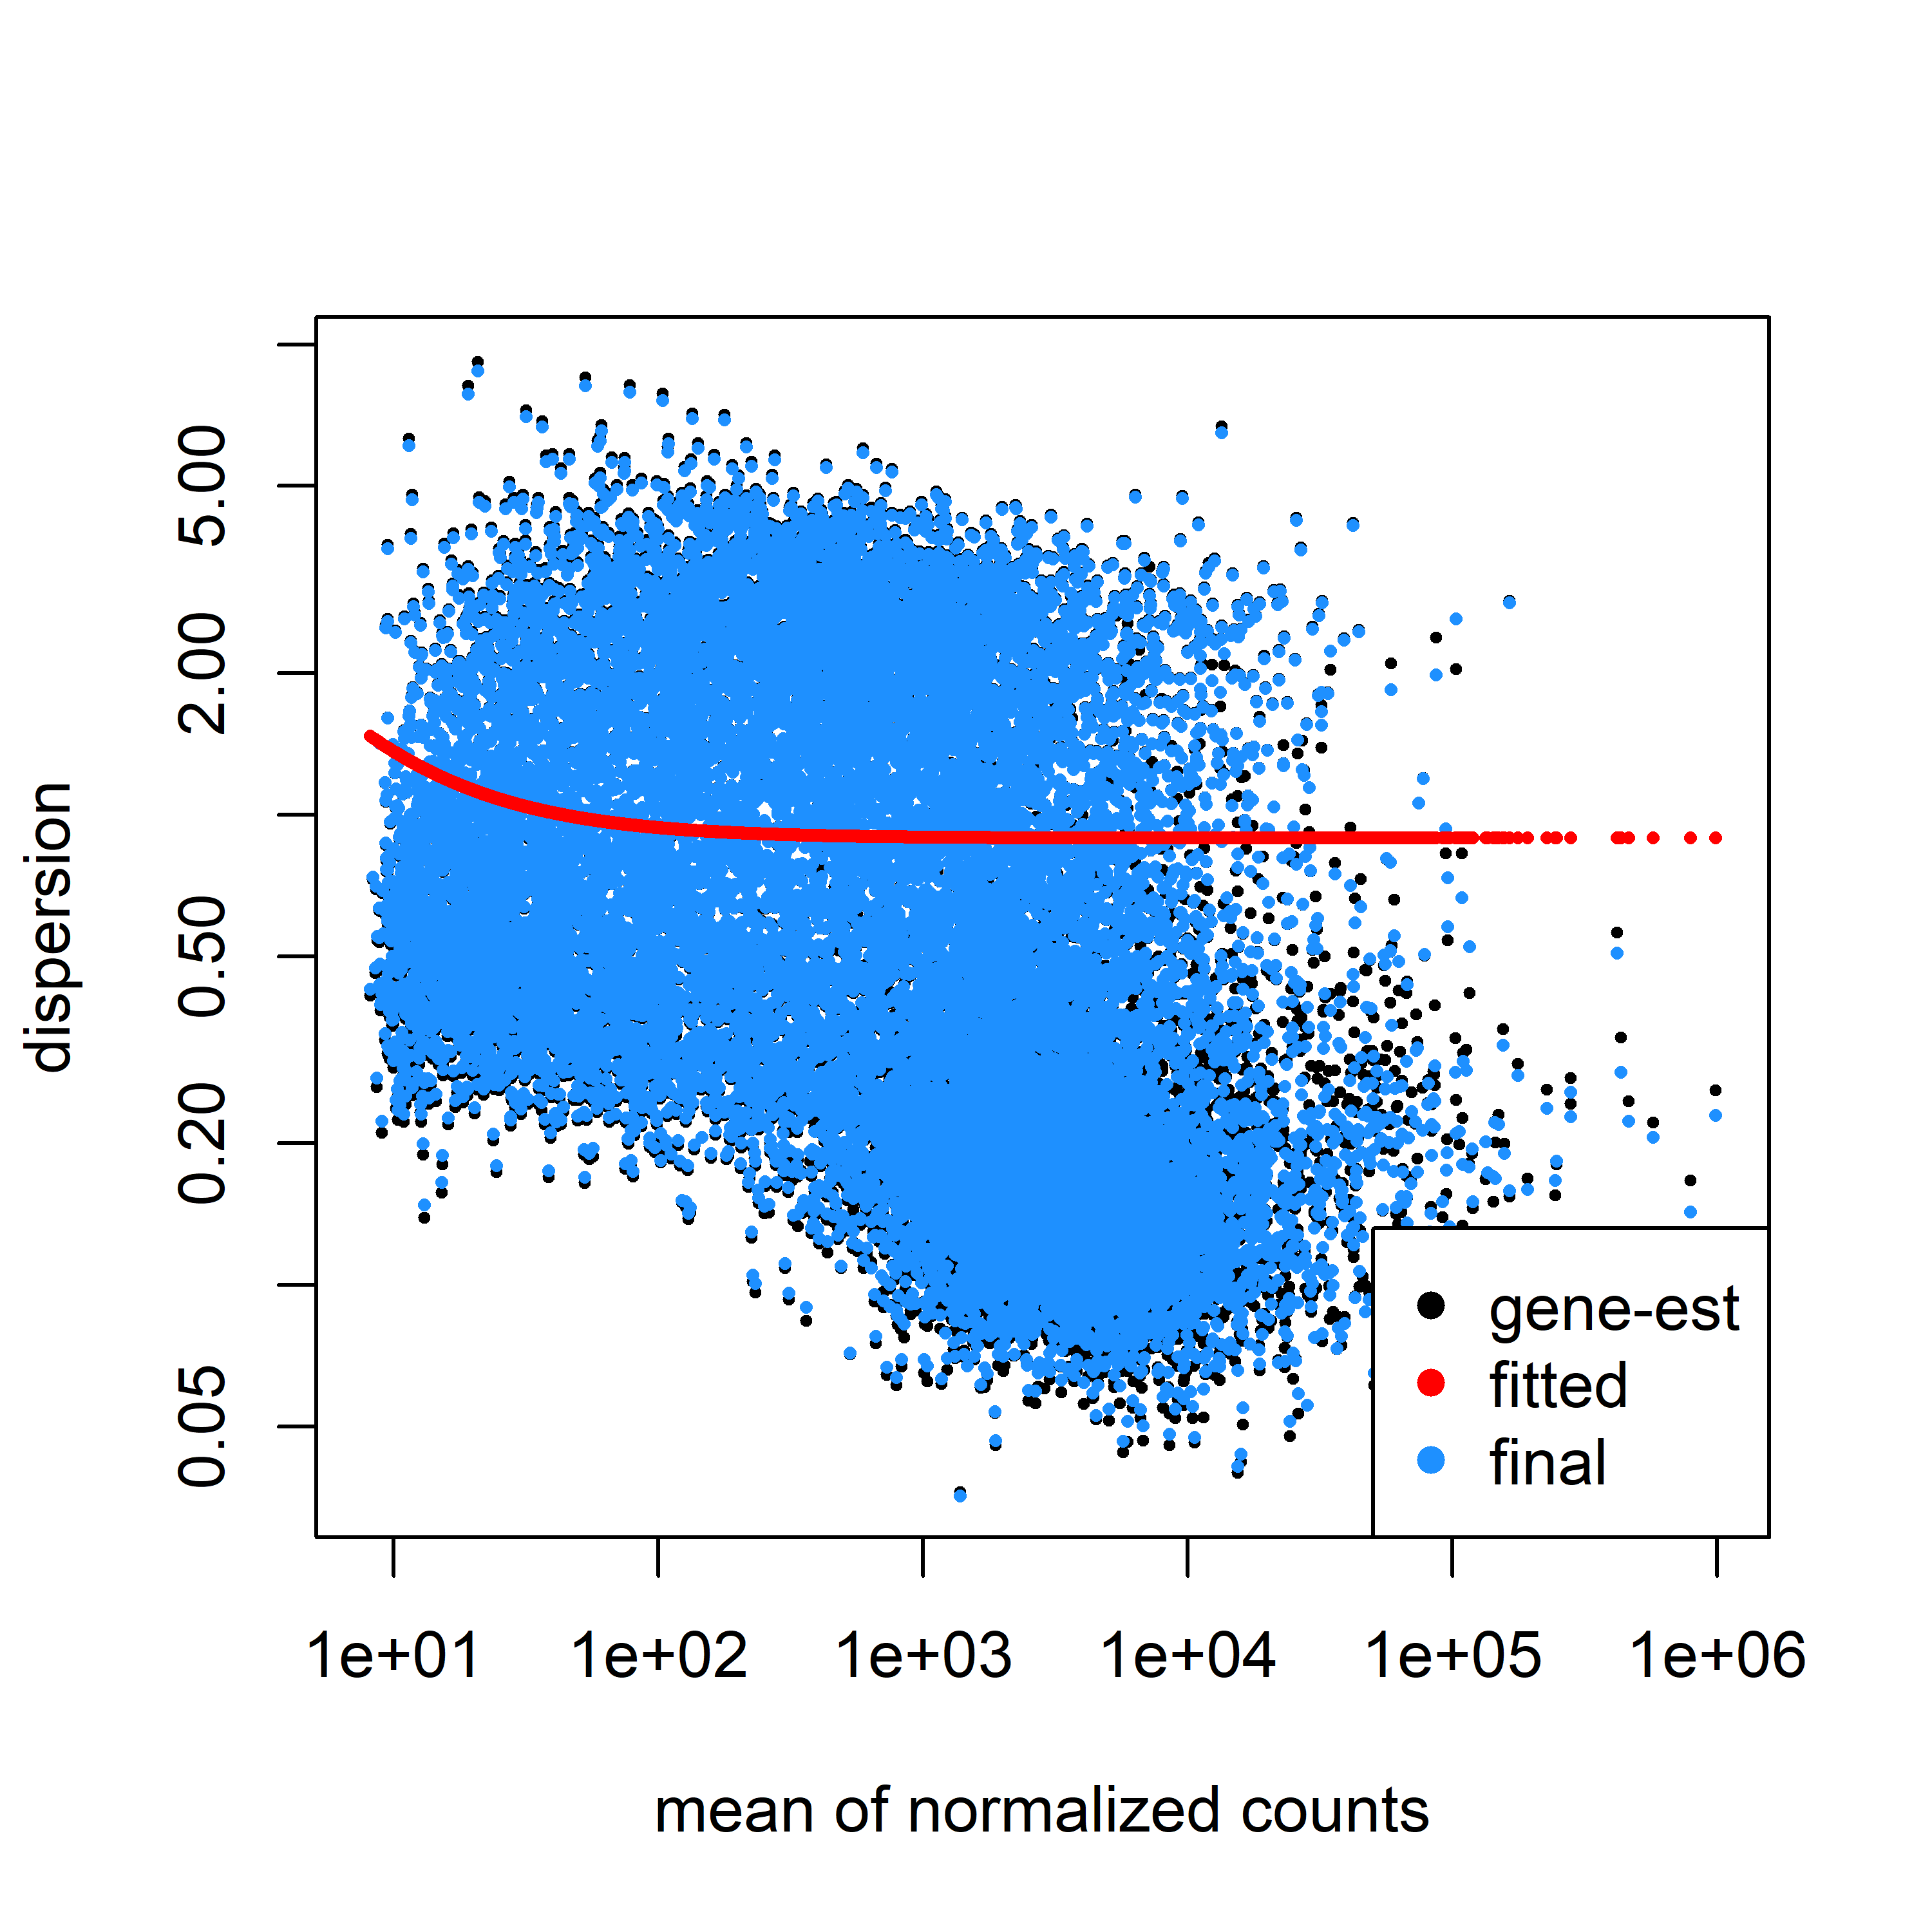
plotDispEsts(dds)
Here is my dispersion model fitted to my data using parametric fit type.
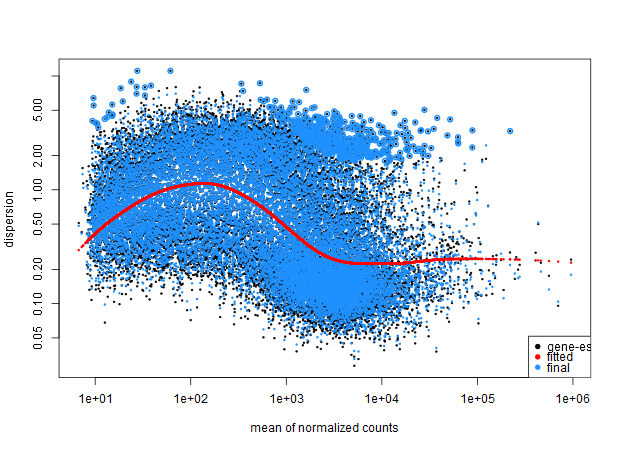
And here is the model with the local fit type.
Any thoughts?
(crossposted from biostars)

I had some help over on biostars, suggesting my dispersions looked bimodal, which I agreed with, and offered the following reasoning:
I couldn't think of a quick way to determine which genes were differentially expressed between these, so I just individually ran a couple of lineages with the design
~ sensitivity.It seems my data is still bimodal, any ideas what may be causing this poor fit?
Bowel:
Lung (ymin = 1e-03 as there as several outliers at 1e-08):
CNS (ymin = 1e-04 as there as several outliers at 1e-08):
He recommended I reach out to you for further help on this Michael Love, any help is really appreciated.