Entering edit mode

Hi, We have 2 groups of control samples that belong to 2 different batches, so I used DESeq2 with the desgin ~Batch+Condition for the test. We are pretty happy with the results. Then we want to visualize the counts with heatmap. I used the function limma::removeBatchEffect to get the counts to plot but we still see very clear different pattern between the 2 batches. Is it expected and should we be worry about this? Here's the code I used the get the couns
vsd <- vst(dds)
vsd$Batch <- as.factor(vsd$Batch)
assay(vsd) <- limma::removeBatchEffect(assay(vsd), vsd$Batch)
top <- assay(vsd)[top_index,] %>% as.data.frame()
pheatmap(top,annotation_col = annot_col, scale = "row", cluster_cols = F,  show_rownames = F
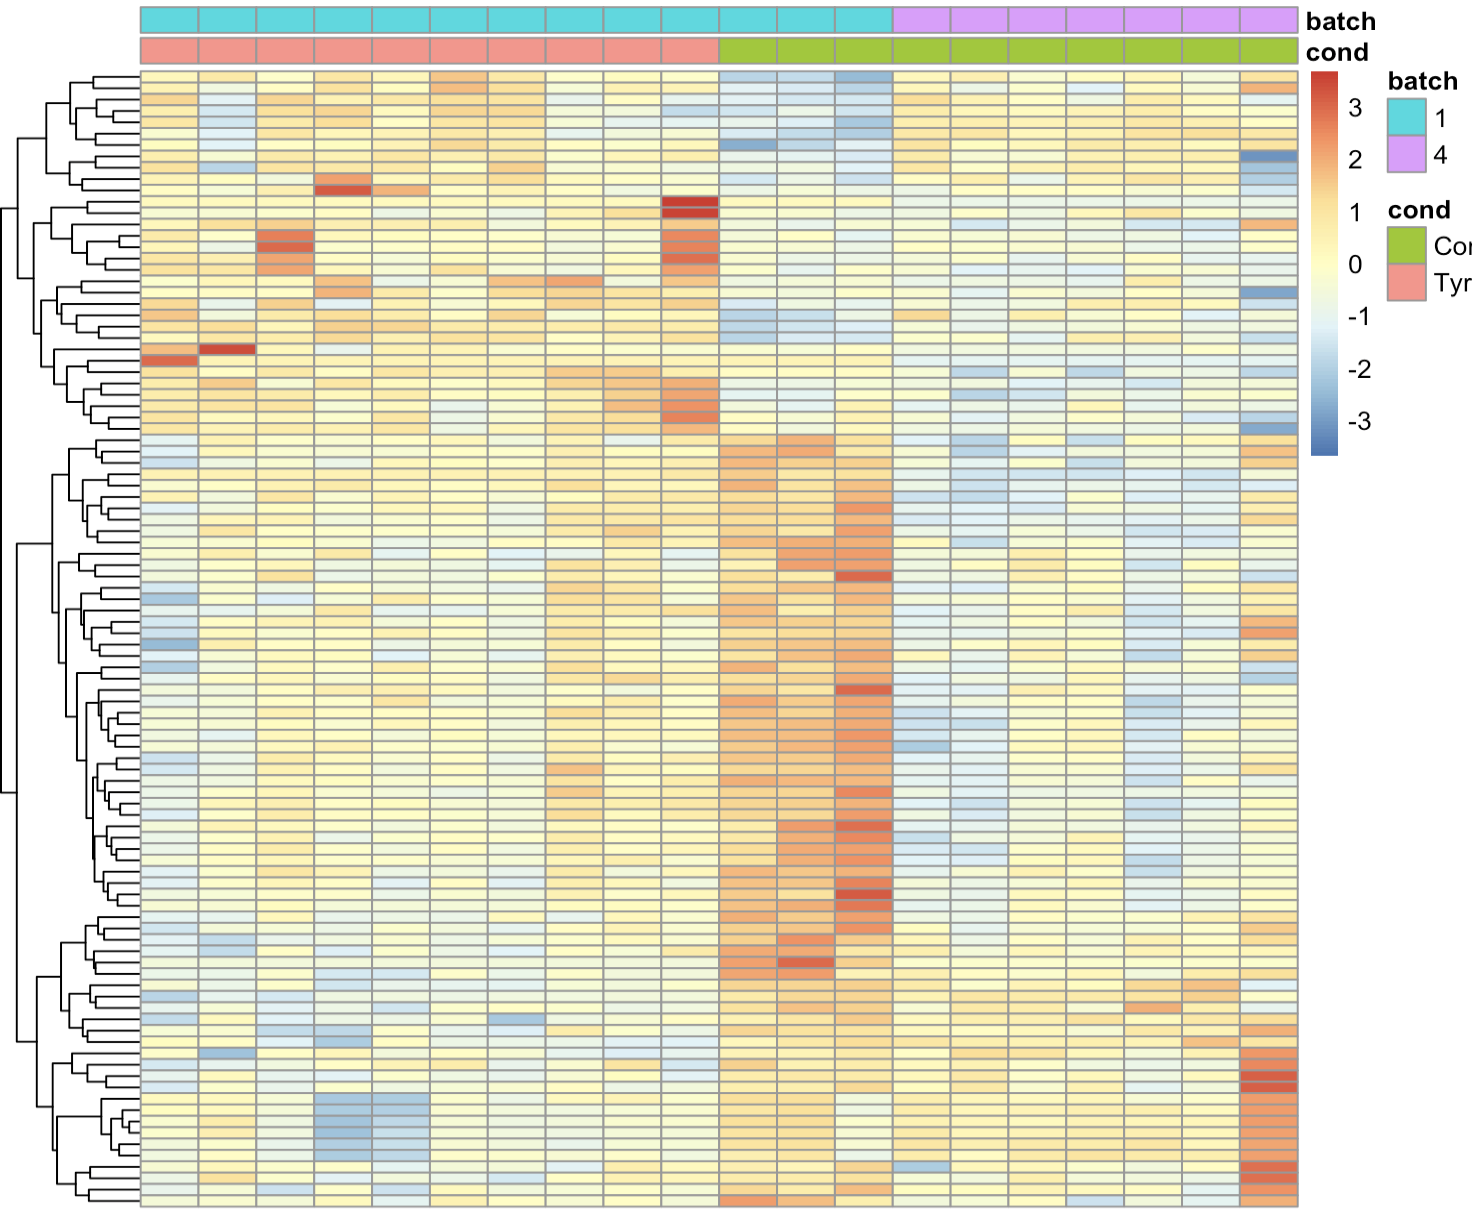
Thanks a lot.


When you are wondering what game to play for fun and entertainment, I recommend you try the eggy car game once, it is really interesting and funny. Let's explore happily.