
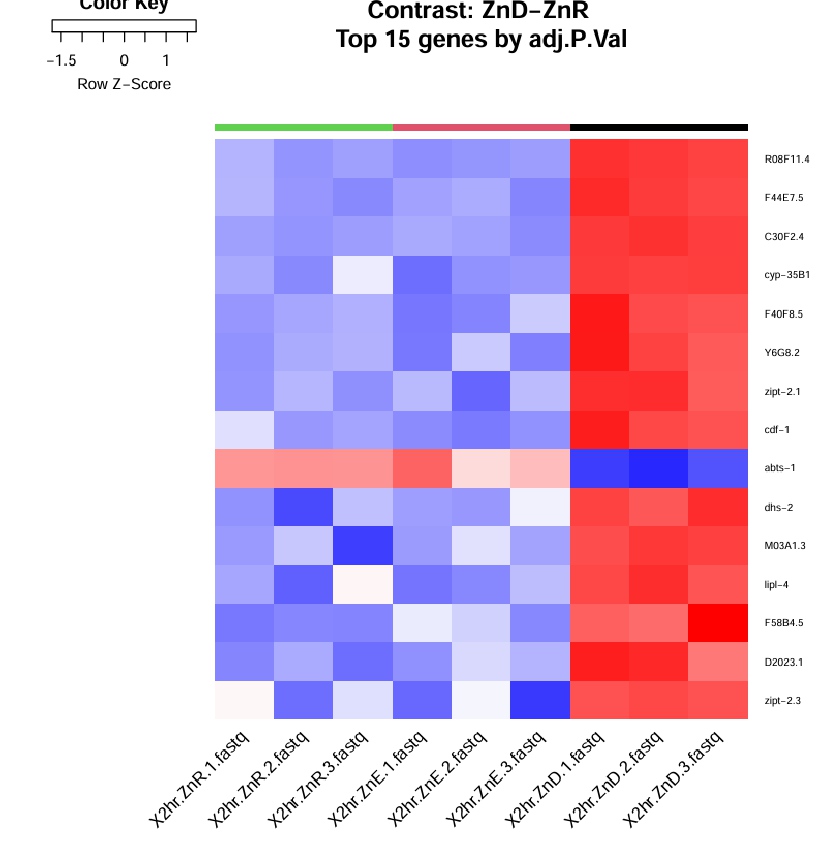
I'm a bit confused about the heatmap output from limma voom. For example, the image below shows RNAseq result of comparing ZnD samples to ZnR (control) samples. In the same limma run I have another group, ZnE, that's used for a second set of comparison, (ZnE to ZnR). The E group has nothing to do with the D-R comparison, but the expression fold changes of all three groups are shown in the heatmap. For me, only the ZnD samples in the last three colums make sense, since they're being compared to the control, and thus most genes are upregulated. How do I interpret the other two groups? What are they being compared to? ZnE isn't even in this set of comparison, and if the ZnR control is showing relative expression to ZnD, how come it's not red for all abts-1 squares?
Thanks.

In your case, you have three groups: ZnD, ZnR, and ZnE. The ZnR group serves as the control, while ZnD and ZnE are being compared against it in separate analyses.