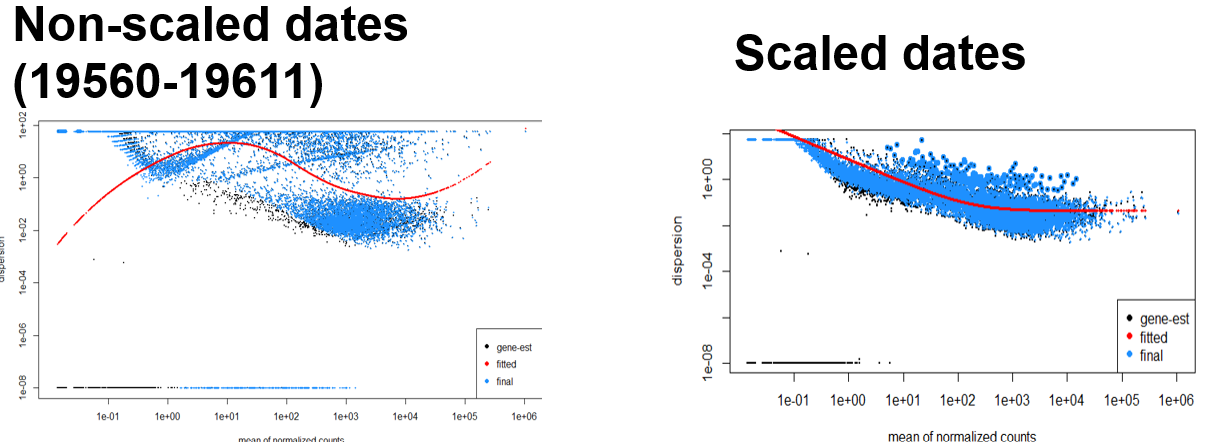
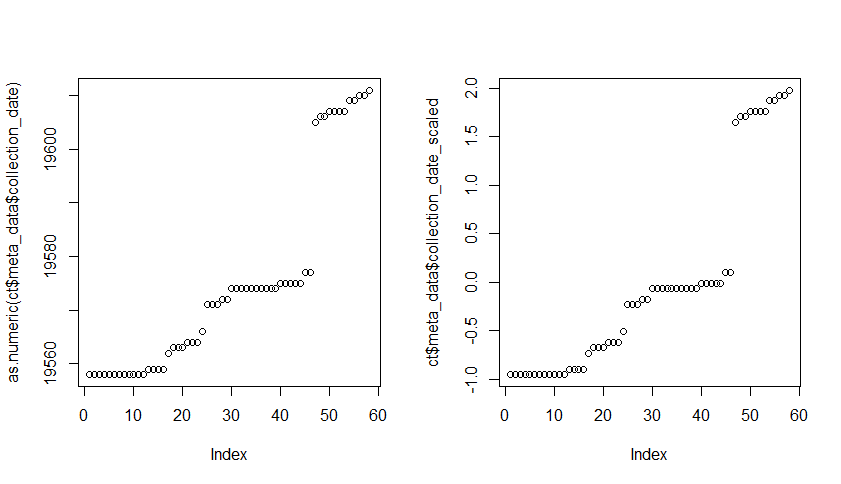
As the picture describes, I have two DESeq2 objects that have the explanatory variable as either a non-scaled date value, or a scaled date value. For my experiment these dates are essentially collection dates of wild caught samples and we are trying to look at seasonal (from summer to fall) changes in transcription.
In the case of the non-scaled date value (format = "%m/%d/%Y"), DESeq2 treats this as a numeric variable with a range from 19560-19660. When I use the non-scaled date value, the dispersion estimates end up all messed up (left pictures - for distribution of date vars and dispersions) but PCA results (PC1 9%; PC2 7%) give nice separation based upon the date value. However, when the scaled date values are used, dispersion estimates fit a ton better (right pictures) but the PCA (PC1 15%; PC2 12%) ends up much more messy (without the expected separation). Also treating the dates as factors yields mostly similar results to the scaled values.
I was wondering essentially why non-scaled value creates such a poor fitting model, but seemingly decent PCA (I know I probably should not trust the model given the dispersion fit)? Is the model being essentially overfitted and that is why I am seeing separation in the PCA?
Any help is appreciated, thanks!


Here is the explanatory variables uses if that helps address the problem as well