Diffbind interpretation of data - fold change
2
0
Entering edit mode
Vera • 0
@a9a0e295
Last seen 21 hours ago
Germany

Hello,

I performed some ATAC analysis using the diffbind package and made an observation which puzzled me:

I used the following command to plot volcano plot:

gluc <-  dba.count(gluc, bUseSummarizeOverlaps = F)

gluc_norm <- dba.normalize(gluc)

gluc_norm_contrast <- dba.contrast(gluc,reorderMeta=list(Condition="reg"), minMembers=2)
gluc_norm_contrast
gluc_diff <- dba.analyze(gluc_norm_contrast)

dba.plotVolcano(gluc_diff)

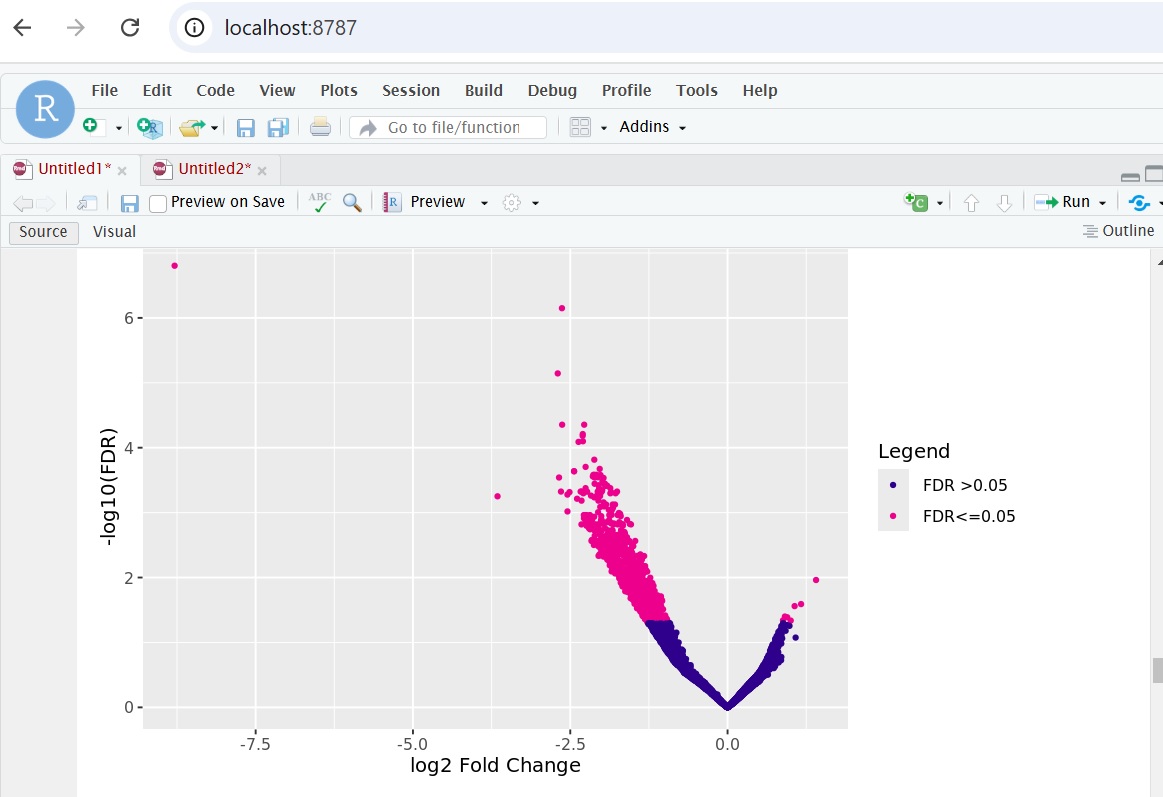
the plot looks like this:

enter image description here

Question 1: since the plot has log2fold-change as x-axis labeling, does it mean when saving the report with:

gluc.DB <- dba.report(gluc_diff)
 write.csv(gluc.DB, file = "gluc_new.csv")

is the "fold"-column in the report file also log2?

Question 2: although the volcano plot shows many genes with log2-fold change between -1 to 0 and 0 and 1, the report only contains genes with "fold"-change < -1 and >1? Is there any filtering happening which I am not aware of?

Thank you very much!

DiffBind • 140 views
ADD COMMENT
0
Entering edit mode
@james-w-macdonald-5106
Last seen 8 minutes ago
United States

It's log fold change, and what you get from dba.report should have the same values (part of dba.plotVolcano includes running the report to get values). As an example, we can use example data.

> library(DiffBind)
> example(dba.contrast)
<things happen>
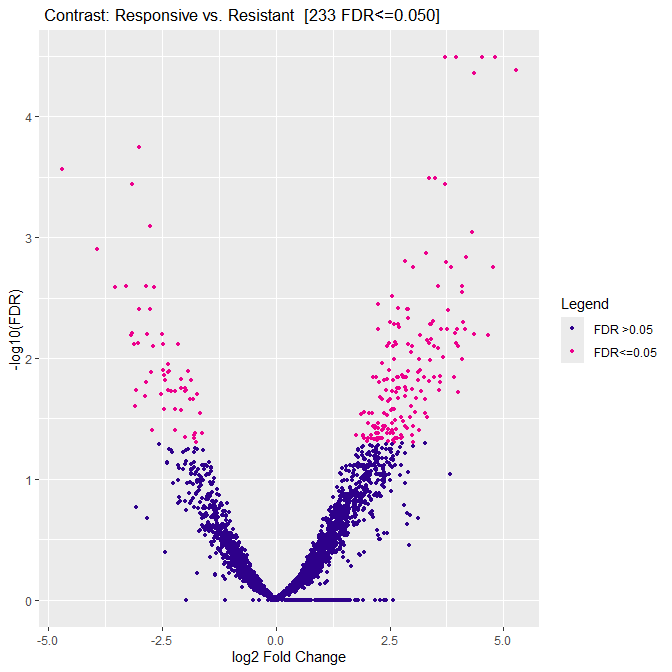
> dba.plotVolcano(tamoxifen, contrast=1)

enter image description here

Where you can see that the range of the logFC is -4.8 or so to just over 5.1 or so. And if we check the report, we find that's true.

> summary(dba.report(tamoxifen, contrast=1)$Fold)
   Min. 1st Qu.  Median    Mean 3rd Qu.    Max. 
 -4.709   1.752   2.542   1.568   3.085   5.277
0
Entering edit mode

Thank you for confirming that the foldchange is log2

ADD REPLY
0
Entering edit mode
Rory Stark ★ 5.2k
@rory-stark-5741
Last seen 21 hours ago
Cambridge, UK

For Question #2, note that by default, dba.report() only returns "differentially bound" intervals where the FDR is less than a threshold (default th<0.05). In your case, all the intervals with fold change between -1 and +1 have higher FDR values (you can see this visually in the volcano plot - all the red dots are above 1 on the y-axis). To get all the points shown in the volcano plot, change the threshold to include all intervals with FDR <= 1:

gluc.all <- dba.report(gluc_diff, th=1)
ADD COMMENT
0
Entering edit mode

Perfect! Thank you so much!

ADD REPLY
0
Entering edit mode

This solved it!

ADD REPLY

Login before adding your answer.

Traffic: 864 users visited in the last hour
Help About
FAQ
Access RSS
API
Stats

Use of this site constitutes acceptance of our User Agreement and Privacy Policy.

Powered by the version 2.3.6