Hello,
I performed some ATAC analysis using the diffbind package and made an observation which puzzled me:
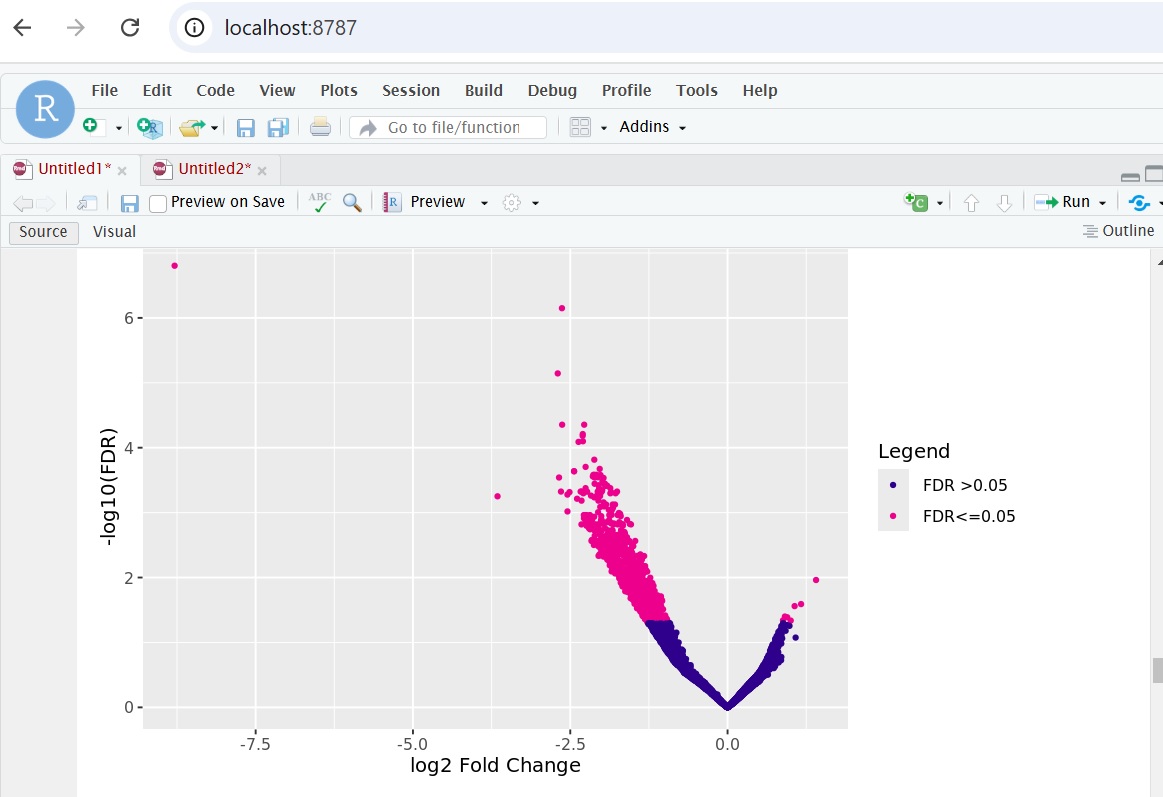
I used the following command to plot volcano plot:
gluc <-  dba.count(gluc, bUseSummarizeOverlaps = F)

gluc_norm <- dba.normalize(gluc)

gluc_norm_contrast <- dba.contrast(gluc,reorderMeta=list(Condition="reg"), minMembers=2)
gluc_norm_contrast
gluc_diff <- dba.analyze(gluc_norm_contrast)

dba.plotVolcano(gluc_diff)
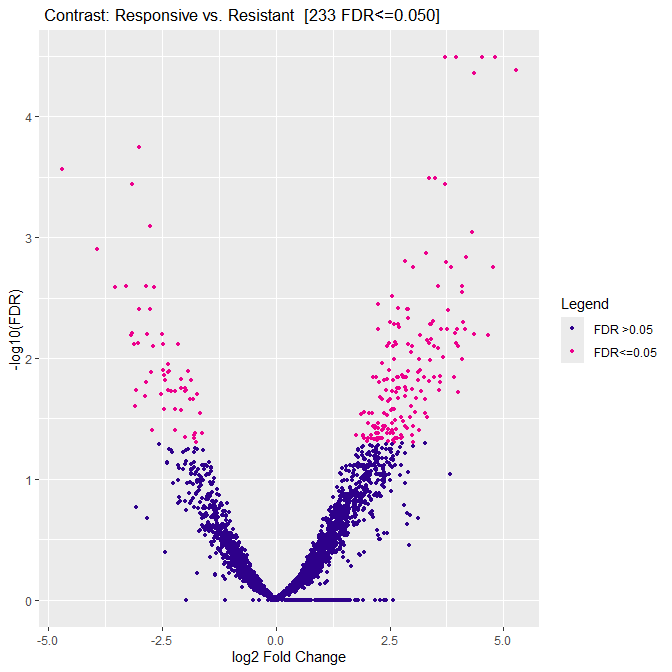
the plot looks like this:
Question 1: since the plot has log2fold-change as x-axis labeling, does it mean when saving the report with:
gluc.DB <- dba.report(gluc_diff)
 write.csv(gluc.DB, file = "gluc_new.csv")
is the "fold"-column in the report file also log2?
Question 2: although the volcano plot shows many genes with log2-fold change between -1 to 0 and 0 and 1, the report only contains genes with "fold"-change < -1 and >1? Is there any filtering happening which I am not aware of?
Thank you very much!


Thank you for confirming that the foldchange is log2