Entering edit mode

@richardallenfriedmanbrooklyn-24118
Last seen 4 months ago
United States
Dear List
I obtained a non-monotonic Voom plot with voomByGroup on Xenium data. Does this compromise the reliability of the results, and if so is there anything I can do about it? Here's the plot
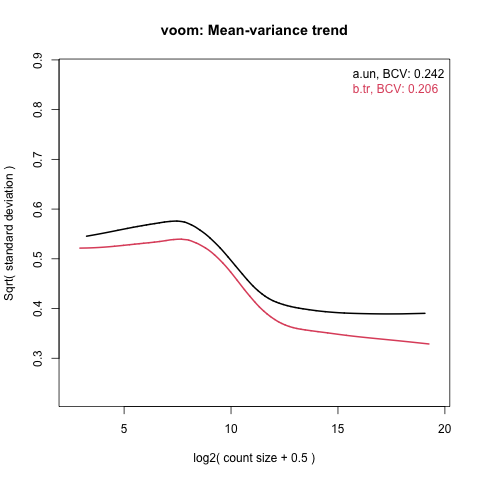
Here is my code up until an including the plot and sessionInfo.
library(Seurat)
library(limma)
library(edgeR)

system("mkdir results/")
system("mkdir results/global/")

source("voomByGroup.R")

targets<-readTargets("data/targets.txt")

sprsmat.tmp=Read10X_h5(paste0("data/",targets[1,1]))

counts= rowSums(sprsmat.tmp)

for (i in 2:nrow(targets)){
    region.tmp.sprsmat=Read10X_h5(paste0("data/",targets[i,1]))
    counts.tmp=rowSums(region.tmp.sprsmat)
    counts=cbind(counts,counts.tmp)
    }

colnames(counts)<-targets$Name
flevels<-unique(targets$Target)
f<-factor(targets$Target,levels=flevels)
y<-DGEList(counts=counts, genes=rownames(counts))
isexpr<-rowSums(y$counts>=10) >= 3
hasannot<-rowSums(is.na(y$genes))==0
y<-y[isexpr & hasannot,]
y$samples$lib.size<- colSums(y$counts)
y$samples$lib.size
y<-calcNormFactors(y)
des<-model.matrix(~0+f)
colnames(des)<-flevels
png("results/global/voomByGrouplot.png")
v=voomByGroup(y, design=des, group=targets$Target,plot="combine")
dev.off()


> sessionInfo()
R version 4.5.1 (2025-06-13)
Platform: x86_64-apple-darwin20
Running under: macOS Sonoma 14.6.1

Matrix products: default
BLAS:   /Library/Frameworks/R.framework/Versions/4.5-x86_64/Resources/lib/libRblas.0.dylib
LAPACK: /Library/Frameworks/R.framework/Versions/4.5-x86_64/Resources/lib/libRlapack.dylib;  LAPACK version 3.12.1

locale:
[1] en_US.UTF-8/en_US.UTF-8/en_US.UTF-8/C/en_US.UTF-8/en_US.UTF-8

time zone: America/New_York
tzcode source: internal

attached base packages:
[1] stats     graphics  grDevices utils     datasets  methods   base

other attached packages:
[1] edgeR_4.6.3        limma_3.64.1       Seurat_5.3.0       SeuratObject_5.1.0
[5] sp_2.2-0

loaded via a namespace (and not attached):
  [1] deldir_2.0-4           pbapply_1.7-2          gridExtra_2.3
  [4] rlang_1.1.6            magrittr_2.0.3         RcppAnnoy_0.0.22
  [7] matrixStats_1.5.0      ggridges_0.5.6         compiler_4.5.1
 [10] spatstat.geom_3.4-1    png_0.1-8              vctrs_0.6.5
 [13] reshape2_1.4.4         hdf5r_1.3.12           stringr_1.5.1
 [16] pkgconfig_2.0.3        fastmap_1.2.0          promises_1.3.3
 [19] bit_4.6.0              purrr_1.1.0            jsonlite_2.0.0
 [22] goftest_1.2-3          later_1.4.2            spatstat.utils_3.1-4
 [25] irlba_2.3.5.1          parallel_4.5.1         cluster_2.1.8.1
 [28] R6_2.6.1               ica_1.0-3              stringi_1.8.7
 [31] RColorBrewer_1.1-3     spatstat.data_3.1-6    reticulate_1.42.0
 [34] parallelly_1.45.0      spatstat.univar_3.1-4  lmtest_0.9-40
 [37] scattermore_1.2        Rcpp_1.1.0             tensor_1.5.1
 [40] future.apply_1.20.0    zoo_1.8-14             sctransform_0.4.2
 [43] httpuv_1.6.16          Matrix_1.7-3           splines_4.5.1
 [46] igraph_2.1.4           tidyselect_1.2.1       dichromat_2.0-0.1
 [49] abind_1.4-8            codetools_0.2-20       spatstat.random_3.4-1
 [52] miniUI_0.1.2           spatstat.explore_3.4-3 listenv_0.9.1
 [55] lattice_0.22-7         tibble_3.3.0           plyr_1.8.9
 [58] shiny_1.11.1           ROCR_1.0-11            Rtsne_0.17
 [61] future_1.58.0          fastDummies_1.7.5      survival_3.8-3
 [64] polyclip_1.10-7        fitdistrplus_1.2-4     pillar_1.11.0
 [67] KernSmooth_2.23-26     plotly_4.11.0          generics_0.1.4
 [70] RcppHNSW_0.6.0         ggplot2_3.5.2          scales_1.4.0
 [73] globals_0.18.0         xtable_1.8-4           glue_1.8.0
 [76] lazyeval_0.2.2         tools_4.5.1            data.table_1.17.8
 [79] RSpectra_0.16-2        locfit_1.5-9.12        RANN_2.6.2
 [82] dotCall64_1.2          cowplot_1.2.0          grid_4.5.1
 [85] tidyr_1.3.1            colorspace_2.1-1       nlme_3.1-168
 [88] patchwork_1.3.1        cli_3.6.5              spatstat.sparse_3.1-0
 [91] spam_2.11-1            viridisLite_0.4.2      dplyr_1.1.4
 [94] uwot_0.2.3             gtable_0.3.6           digest_0.6.37
 [97] progressr_0.15.1       ggrepel_0.9.6          htmlwidgets_1.6.4
[100] farver_2.1.2           htmltools_0.5.8.1      lifecycle_1.0.4
[103] httr_1.4.7             statmod_1.5.0          mime_0.13
[106] bit64_4.6.0-1          MASS_7.3-65
>
I would appreciate any guidance you might be able to offer.
Thanks and best wishes,
Rich
Richard Friedman
Herbert Irving Comprehensive Cancer Center
Columbia University Irving Medical Center

Thank you. I willleave as is and proceed.