
Hi,
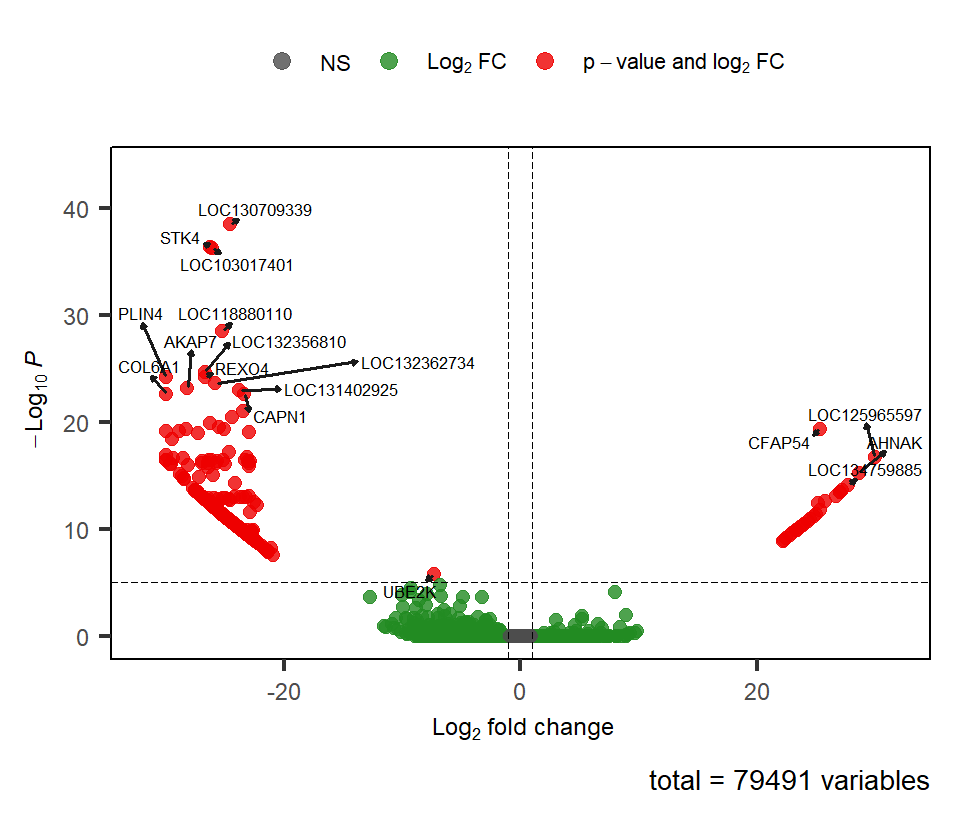
I'm running DESeq2 to compare the gene differential expression of 2 groups. There's a lot of variability in my data and also my 2 groups have uneven samples (22 vs 11). If I run the standard DESeq with pre-filtering and lfc threshold of 1, as reported below, I have a volcano plot with wings.
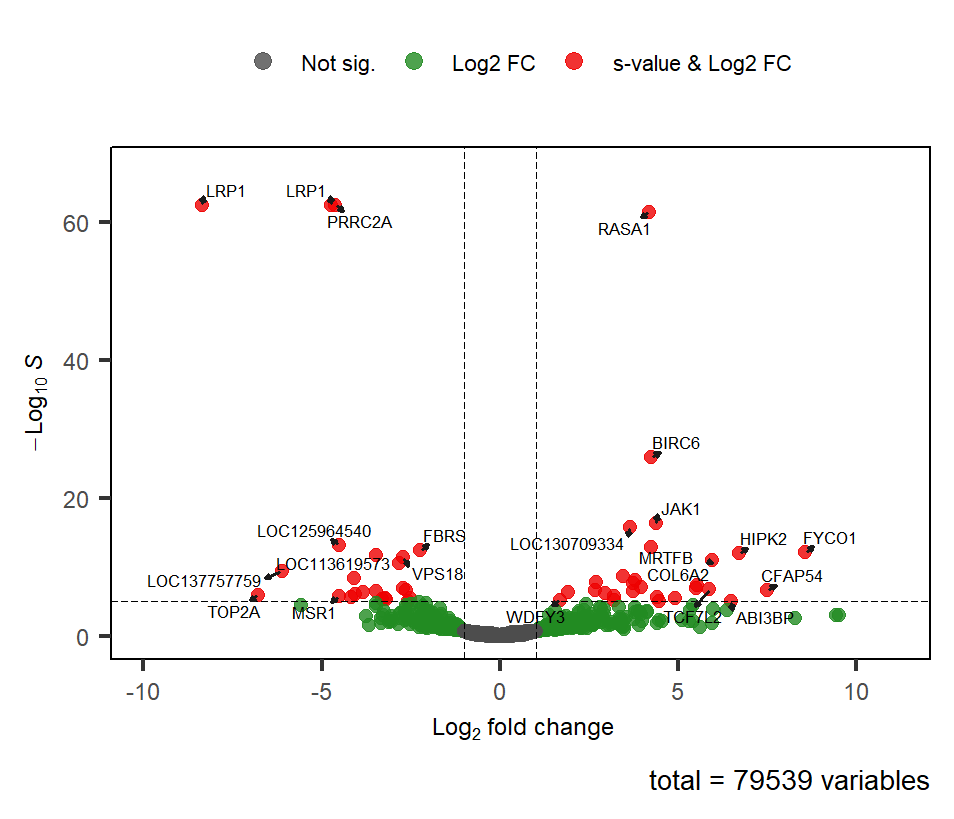
So I decided to try the apeglm shrinkage within DESeq2, applying the same lfc threshold of 1. (The shrunken results are reported below the non-shrunken).
The significant genes according to the s-value < 0.005 are different from the non-shrunken results, which makes sense, but it's not clear if I can report these results as my significantly differentially expressed genes, providing the s-value as a statistic.
My understanding is that the s-value doesn't assess the significance of the differential expression but the confidence of the lfc direction.
So, if the genes are significant according to the s-value but not to the adjusted p-value of the non-shrunken results, does it mean that I don't have significantly differentially expressed genes after the shrinkage?
I appreciate any help with this.
Thank you
#create dds####
dds <- DESeqDataSetFromTximport(txi, sampleTable_bg, ~ 1)
#pre-filtering
keep <- rowSums(counts(dds) >= 10) >= 5
dds <- dds[keep,]
#add design and condition to dds
design(dds) <- ~ group
dds$group <- relevel(dds$group, ref = "EM")
levels(colData(dds)$group)
#run DESeq2
dds <- DESeq(dds)
#results
res_bg <- results(dds, lfcThreshold = 1, alpha = 0.05)
summary(res_bg)

out of 79491 with nonzero total read count
adjusted p-value < 0.05
LFC > 1.00 (up)    : 30, 0.038%
LFC < -1.00 (down) : 460, 0.58%
outliers [1]       : 0, 0%
low counts [2]     : 48, 0.06%
(mean count < 0)
[1] see 'cooksCutoff' argument of ?results
[2] see 'independentFiltering' argument of ?results
 > res_shrnkLFC <- lfcShrink(dds, coef = "group_LM_vs_EM", type = "apeglm", lfcThreshold = 1)
using 'apeglm' for LFC shrinkage. If used in published research, please cite:
    Zhu, A., Ibrahim, J.G., Love, M.I. (2018) Heavy-tailed prior distributions for
    sequence count data: removing the noise and preserving large differences.
    Bioinformatics. https://doi.org/10.1093/bioinformatics/bty895
computing FSOS 'false sign or small' s-values (T=1)

> summary(res_shrnkLFC)

out of 79491 with nonzero total read count
s-value < 0.005
LFC > 1.00 (up)    : 75, 0.094%
LFC < -1.00 (down) : 74, 0.093%

Hi Michael Love,
Can you help me with this, please?
Thanks