
I have been using MotifbreakR to assess out how mutations to transcription factor binding sites disrupt DNA-protein interactions.
The analysis went fine but I'm unsure about how the output values relate to one another.
Here is the code I used for the analysis which ran fine:
MG_results_ADsnps_1eNeg3 <- motifbreakR(snpList = MG.snps.mb, filterp = TRUE,
                                    pwmList = motifbreakR_motif,
                                    threshold = 1e-3,
                                    method = "ic",
                                    bkg = c(A=0.25, C=0.25, G=0.25, T=0.25),
                                    BPPARAM = BiocParallel::bpparam())

MG_results_ADsnps_withP_1eNeg3 <- calculatePvalue(MG_results_ADsnps_1eNeg3)
Notice I calculate the p-values in the second command.
The output (abridged) looks like this
rsID REF ALT pctRef pctAlt scrRef scrAlt Refpvalue Altpvalue alleleRef alleleAlt
rs28  T   C  0.76   0.98    5.68    7.31  0.0076   6.17E-06      0        1
rs93  C   A  0.96   0.72    7.68    5.74  5.30E-05 0.0161        1        0
The vignette says that
motifBreakR scores and reports the reference and alternate alleles of the sequence (F(sREF,M) and F(sALT,M)), and provides the matrix scores psREF and psALT of the SNP (or variant). The scores are scaled as a fraction of scoring range 0-1 of the motif matrix, M. If either of F(sREF,M) and F(sALT,M) is greater than a user-specified threshold (default value of 0.85) the SNP is reported.
My understanding is that these scores relate to the alleleRef and alleleAlt columns of the table, i.e. these SNPs are both reported as at least one of the alleles are have a value greater than the 0.85 default.
That's fine. The issue is how this relates to the other values i.e the scrRef/Alt and the Ref/Altpvalues columns. The vingette says:
pctRef and pctAlt display the the score for the motif in the sequence as a percentage of the best score that motif could achieve on an ideal sequence. In other words (scoreVariant−minscorePWM)/(maxscorePWM−minscorePWM). We can also see the absolute scores for our method in scoreRef and scoreAlt and thier respective p-values.
Question 1 - how are the absolute scores (i.e. scrRef. and scrAlt) generated and how do they relate to the alleleRef and alleleAlt scores?
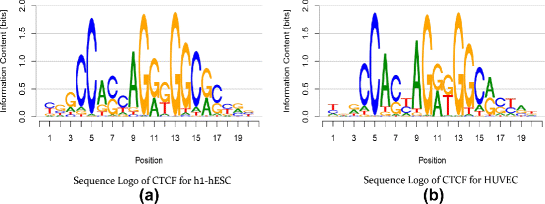
As this package works with position probability matrices, the method I have chosen is the information content method to generate scores. As the maximum information content value can reach is 2 (y-axis below), I'm not sure how the absolute values are generated. Note the absolute values in the output table are larger than two.
Question 2 - What value does the 'scoreVariant' in quote 2 in the vignette relate to in the output table, if any. Is this an overall score for the motif or for the allele?
Question 3 - What values are the percentages in the table calculated from? Are these derived from values in the output table i.e. the alleleRef/Alt or scrRef/Alt columns, or are these calculated from values I don't see that are generated during the motifbreakR processing?
Overall, an explanation of how the output values relate to what is reported in the vignette would be helpful, bearing in mind I'm not a mathematician or statistician. I have read this paper describing how MotifbreakR generated the p-value, and found this link explaining how position probability matrices are generated in Motifbreaker, but they don't really address these questions.