Entering edit mode

Graeme Smethurst
▴
10
@graeme-smethurst-1867
Last seen 9.6 years ago
Hi,
On the topic of RNA degradation I'd be very greatful if anyone could
point me in the direction of publications which show that RNA
degradation typically occurs in the 5' to 3' direction.
This is something that I have read a lot recently on this, and the
Yahoo groups qPCR mailing list. However I have not seen any
publications that show it to be the case.
As I understand it, an alternative reason that 5'-3' ratios/plots
could be indicative of RNA degradation is the following:
* RNA degradation occurs (essentially) randomly throughout the
molecule
* Reverse transcription occurs in the 5'-3' direction, hence the RNA
molecule in question is copied in its 3'-5' direction.
* Reverse transcription (RT) of degraded RNA will (on average)
terminate much sooner than reverse transcription of intact RNA, hence
there will be a larger difference between 3' and 5' expression values
in degraded RNA than intact RNA. This therefore means that in addition
to assessing RNA degradation, 5'-3' ratios/plots also assess the
quality of RT steps in sample labelling.
If anyone does know of evidence that RNA degraation does occur in
5'-3' direction please let me know.
Many Thanks
Graeme
-----Original Message-----
From: bioconductor-bounces@stat.math.ethz.ch [mailto:bioconductor-
bounces@stat.math.ethz.ch] On Behalf Of Sarwar, Rizwan
Sent: 06 September 2006 11:43
To: bioconductor at stat.math.ethz.ch
Cc: Jordi Altirriba Guti?rrez; martin.doherty at gmail.com
Subject: Re: [BioC] R: Degradation plots - Affy package
Martin
I have seen the same picture as you on RAE 230A and 2.0 arrays, where
the peak is actually the penultimate probe at the 3'end for all of my
arrays in 4 experiments.
Rizwan
-----Original Message-----
From: Alberto Goldoni [mailto:alberto.goldoni@eurogene.org]
Sent: 05 September 2006 14:22
To: 'Jordi Altirriba Guti?rrez'; martin.doherty at gmail.com
Cc: bioconductor at stat.math.ethz.ch
Subject: [BioC] R: Degradation plots - Affy package
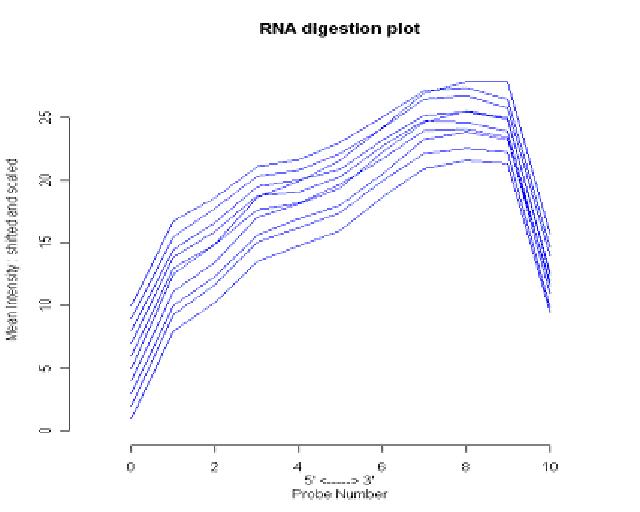
4.3 RNA degradation plots
The functions AffyRNAdeg, summaryAffyRNAdeg, and plotAffyRNAdeg aid in
assessment
of RNA quality. Individual probes in a probeset are ordered by
location
relative to
the 50 end of the targeted RNA molecule.A
ymetrix (1999) Since RNA degradation
typically starts from the 50 end of the molecule, we would expect
probe
intensities to be
systematically lowered at that end of a probeset when compared to the
30
end. On each
chip, probe intensities are averaged by location in probeset, with the
average taken over
probesets. The function plotAffyRNAdeg produces a side-by-side plots
of
these means,
making it easy to notice any 50 to 30 trend. The function
summaryAffyRNAdeg produces
a single summary statistic for each array in the batch, o
ering a convenint measure of
the severity of degradation and significance level. For an example
this is the explanation of the affy vignette.
Best regards
Dr Alberto Goldoni
Medical Genetics Unit
S. Orsola-Malpighi Hospital
Via Massarenti n.9, Pad 11
40100 Bologna, Italy
Mobile Phone: +39-338-4145970
Fax: +39-051-636-4004
alberto.goldoni at eurogene.org
www.eurogene.org
www.lagem.it
-----Messaggio originale-----
Da: bioconductor-bounces at stat.math.ethz.ch
[mailto:bioconductor-bounces at stat.math.ethz.ch] Per conto di Jordi
Altirriba Guti?rrez
Inviato: marted? 5 settembre 2006 15.05
A: martin.doherty at gmail.com
Cc: bioconductor at stat.math.ethz.ch
Oggetto: [BioC] Degradation plots - Affy package
Hi Martin,
Could you tell us more information? Which array are you using? How
many
probes have the probeset?
I have seen these plots in the past with the Rat Genome U34 Set.
The idea of the Affy deg plots is that all the arrays have a similar
behaviour, as in your case. So I would take as acceptable your arrays.
HTH,
Jordi Altirriba
PhD student
Hospital Clinic (Barcelona, Spain)
>Degradation plots that I have done in the past have usually
>produced plots that increase towards the 3' end in a roughly
>uniform manner. I have done this (breast) experiment on a new
>chip which results in the folowing plot:
>
>http://www.redbrick.dcu.ie/~osama/images/RNAdeg.jpg
>
>This seem to be rather strange,as it peaks in intensity before
>the farthest 3' end. Is there any explanation for this or is there
>any documetnation of this happening elsewhere?
_______________________________________________
Bioconductor mailing list
Bioconductor at stat.math.ethz.ch
https://stat.ethz.ch/mailman/listinfo/bioconductor
Search the archives:
http://news.gmane.org/gmane.science.biology.informatics.conductor
[[alternative HTML version deleted]]
--------------------------------------------------------
This email is confidential and intended solely for the use
o...{{dropped}}
