Entering edit mode

I'm using ComplexHeatmap to plot z-scaled data. I want to set the order of my samples (columns), which can be done by setting column_order=. However, when I use this function, the z-score values that are plotted change - it looks like the average value for the samples within a group are now plotted.
Here's a simplified example using values from 5 genes. Values for my R variables are in code chunks at the bottom.
library(DESeq2)
library(ComplexHeatmap)
library(circlize)
rlogTop25 <- (assay(rld)[sigTop25,]
z.TopLFC <- t(scale(t(rlogTop25), center=TRUE, scale=TRUE))
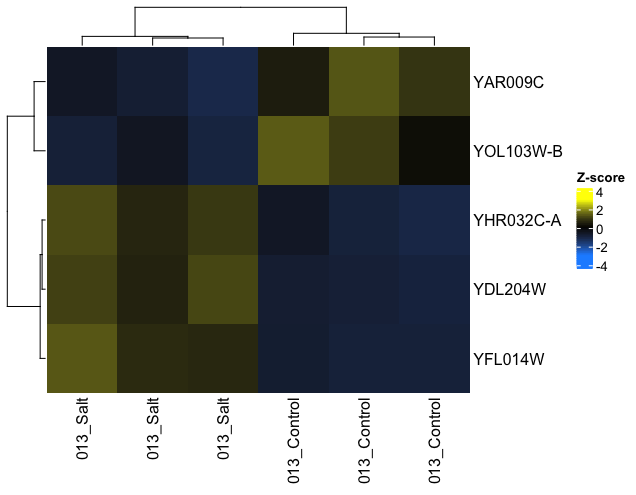
#Correctly Plots
Heatmap(z.TopLFC,
col = colorRamp2(c(-3, 0, 3), c('dodgerblue', 'black', 'yellow')),
heatmap_legend_param = list (
title = "Z-score")
)
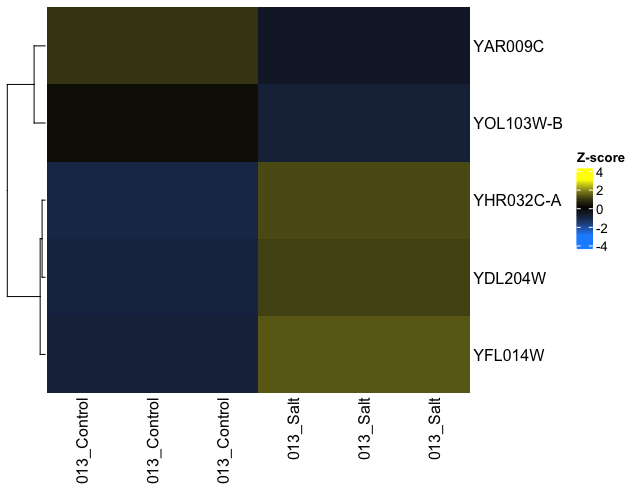
#Plots averaged(?) Z-values for group of samples
Heatmap(z.TopLFC,
        col = colorRamp2(c(-3, 0, 3), c('dodgerblue', 'black', 'yellow')),
        column_order=sort(colnames(z.TopLFC)),
        heatmap_legend_param = list (
          title = "Z-score")
)
> rlogTop25
          013_Control 013_Salt 013_Control 013_Salt 013_Control 013_Salt
YFL014W      6.347657 8.132517    6.462191 7.591956    6.360166 7.637381
YAR009C     10.166573 8.480758    9.699538 7.838010   10.682334 8.217700
YDL204W      7.560660 9.085627    7.693605 9.150839    7.633052 8.736366
YHR032C-A    5.822386 6.743593    6.025686 6.639762    5.880813 6.519343
YOL103W-B    8.929396 8.151790    9.847492 8.064004    9.552077 8.415369
> z.TopLFC
          013_Control   013_Salt 013_Control   013_Salt 013_Control   013_Salt
YFL014W    -0.9385917  1.3222492  -0.7935150  0.6375331  -0.9227476  0.6950720
YAR009C     0.8505378 -0.6040332   0.4475662 -1.1586147   1.2955512 -0.8310072
YDL204W    -0.9856466  1.0201568  -0.8107826  1.1059313  -0.8904295  0.5607705
YHR032C-A  -1.1002669  1.1544011  -0.6026881  0.9002739  -0.9572662  0.6055462
YOL103W-B   0.1376152 -0.9042738   1.3677420 -1.0218953   0.9719247 -0.5511128
attr(,"scaled:center")
  YFL014W   YAR009C   YDL204W YHR032C-A YOL103W-B
 7.088644  9.180819  8.310025  6.271931  8.826688
attr(,"scaled:scale")
  YFL014W   YAR009C   YDL204W YHR032C-A YOL103W-B
0.7894670 1.1589778 0.7602771 0.4085777 0.7463425
> sort(colnames(z.TopLFC))
[1] "013_Control" "013_Control" "013_Control" "013_Salt"    "013_Salt"    "013_Salt"