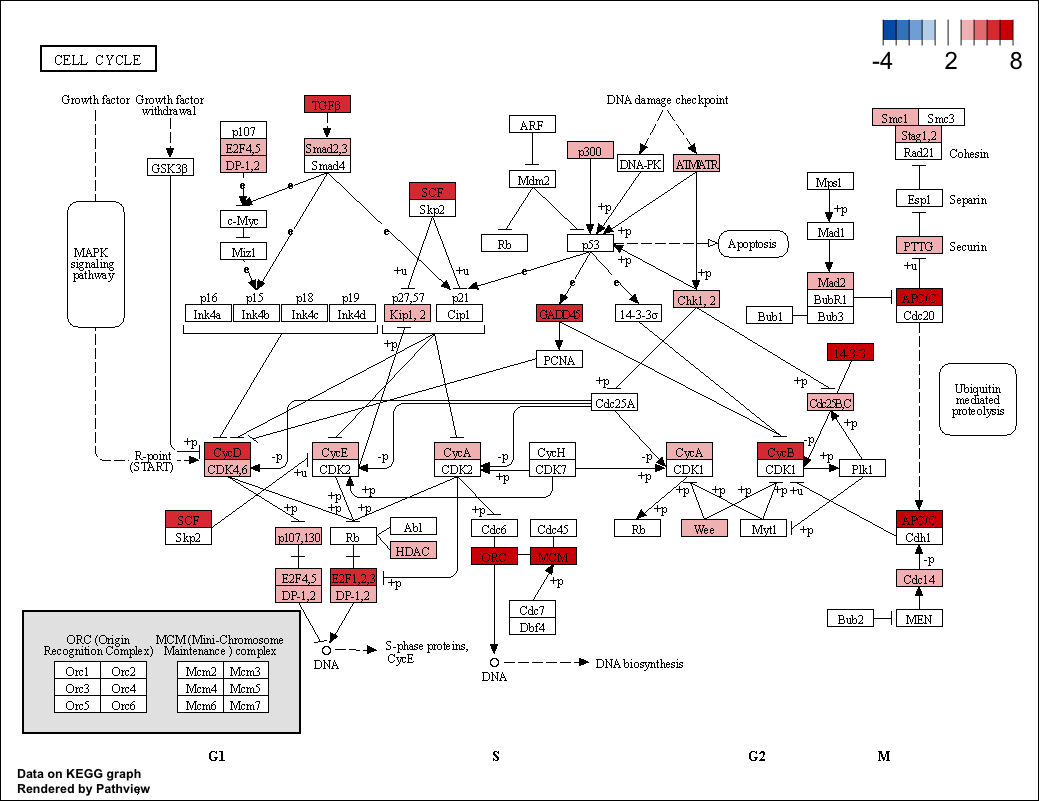
Hello,
I've noticed that some of the input values in several genes don't match the output from Pathview. I have some integer scores from multiple samples, one of which is a control, and all values are estimated as 2. However, when I plot against the cell cycle pathway, I'm observing that some genes are rendered with values of 3, 4 up to 12 and I'm unsure where this is coming from.
If you notice in Figure 1, which is the control, there are several genes with values other than 2 (input). e.g. 4, 6, 8, .... The current explanation is that the output values are the sum of the scores of the genes listed in the all.mapped e.g. if six genes are present, then the output reflects the sum of all six genes. Is there a way to turn this off? or to have unique mappings per HGNC Symbol?
A reproducible example below,
Thank you in advance,
-Rodrigo
## libraries to load
library(biomaRt)
library(pathview)

## list of pathways availabe w/in pathview
data(paths.hsa)

## use GRCh37 biomart
ensembl = useMart(biomart="ENSEMBL_MART_ENSEMBL", host="grch37.ensembl.org", path="/biomart/martservice" ,dataset="hsapiens_gene_ensembl")

## get all hgnc_symbols in BioMart
bm <- getBM(attributes = "hgnc_symbol", mart = ensembl)$hgnc_symbol

## set seed
set.seed(2021)

## build a control with baseline across all genes,
## build a treatment case with a random uniform distribution to simulate CNV
mm <- matrix(cbind(rep(2, length(bm)),
                   round(runif(length(bm), min = 0, max = 8))),
             ncol = 2, dimnames = list(bm, c("ctrl", "trt")))

## pull and summarise control data
## expect only 2 in all genes
ctrl <- mm[, "ctrl"]

## pathview for control only
pv.ctrl <- pathview(ctrl,
                    pathway.id = "hsa04110" , species = "hsa",
                    out.suffix = "ctrl.test",
                    gene.idtype = "SYMBOL", limit = c(-4, 8),
                    high = "#D40000FF", mid = "#FFFFFF", low = "#005EB8FF")
## summary of both input and output data
summary(ctrl)
summary(pv.ctrl$plot.data.gene$ge1)
#>    Min. 1st Qu.  Median    Mean 3rd Qu.    Max.
#>       2       2       2       2       2       2
#> > summary(pv.ctrl$plot.data.gene$ge1)
#>    Min. 1st Qu.  Median    Mean 3rd Qu.    Max.
#>   2.000   2.000   2.000   3.609   4.000  24.000

head(pv.ctrl$plot.data.gene)
#> !> head(pv.ctrl$plot.data.gene)
#>    kegg.names labels
#>  4       1029 CDKN2A
#>  5      51343   FZR1
#>  6       4171   MCM2
#>  7       4998   ORC1
#>  8        996  CDC27
#> 9        996  CDC27
#>                                                             all.mapped type   x
#> 4                                                                 1029 gene 532
#> 5                                                                51343 gene 919
#> 6                                        4171,4172,4173,4174,4175,4176 gene 553
#> 7                                      4998,4999,5000,5001,23594,23595 gene 494
#> 8 996,8697,8881,10393,25847,29882,29945,51433,51434,51529,64682,246184 gene 919
#> 9 996,8697,8881,10393,25847,29882,29945,51433,51434,51529,64682,246184 gene 919
#>     y width height ge1 mol.col
#> 4 124    46     17   2 #FFFFFF
#> 5 536    46     17   2 #FFFFFF
#> 6 556    46     17  12 #D40000
#> 7 556    46     17  12 #D40000
#> 8 297    46     17  24 #D40000
#> 9 519    46     17  24 #D40000


## multi pathview on both
pv.multi <- pathview(mm,
                     pathway.id = "hsa04110" , species = "hsa",
                     out.suffix = "ctrl_trt.test",
                     gene.idtype = "SYMBOL", limit = c(-4, 8),
                     high = "#D40000FF", mid = "#FFFFFF", low = "#005EB8FF")
## summary of both input and output data
summary(mm[, "trt"])
summary(pv.multi$plot.data.gene$trt)
#> > ## summary of both input and output data
#> > summary(mm[, "trt"])
#>    Min. 1st Qu.  Median    Mean 3rd Qu.    Max.
#>   0.000   2.000   4.000   4.011   6.000   8.000
#> > summary(pv.multi$plot.data.gene$trt)
#>    Min. 1st Qu.  Median    Mean 3rd Qu.    Max.
#>   0.000   3.000   5.000   6.761   8.000  42.000

## session info
sessionInfo()
#> R version 4.0.3 (2020-10-10)
#> Platform: x86_64-apple-darwin17.0 (64-bit)
#> Running under: macOS Mojave 10.14.6
#>
#> Matrix products: default
#> BLAS:   /Library/Frameworks/R.framework/Versions/4.0/Resources/lib/libRblas.dylib
#> LAPACK: /Library/Frameworks/R.framework/Versions/4.0/Resources/lib/libRlapack.dylib
#>
#> locale:
#> [1] en_US.UTF-8/en_US.UTF-8/en_US.UTF-8/C/en_US.UTF-8/en_US.UTF-8
#>
#> attached base packages:
#> [1] stats     graphics  grDevices utils     datasets  methods   base
#>
#> other attached packages:
#> [1] pathview_1.30.1 biomaRt_2.46.3
#>
#> loaded via a namespace (and not attached):
#>  [1] KEGGREST_1.30.1      progress_1.2.2       tidyselect_1.1.0
#>  [4] purrr_0.3.4          vctrs_0.3.7          generics_0.1.0
#>  [7] stats4_4.0.3         BiocFileCache_1.14.0 utf8_1.2.1
#> [10] blob_1.2.1           XML_3.99-0.6         rlang_0.4.10
#> [13] pillar_1.6.0         withr_2.4.2          glue_1.4.2
#> [16] DBI_1.1.1            rappdirs_0.3.3       Rgraphviz_2.34.0
#> [19] BiocGenerics_0.36.1  bit64_4.0.5          dbplyr_2.1.0
#> [22] lifecycle_1.0.0      zlibbioc_1.36.0      stringr_1.4.0
#> [25] Biostrings_2.58.0    memoise_2.0.0        Biobase_2.50.0
#> [28] IRanges_2.24.1       fastmap_1.1.0        parallel_4.0.3
#> [31] curl_4.3             AnnotationDbi_1.52.0 fansi_0.4.2
#> [34] Rcpp_1.0.6           openssl_1.4.3        cachem_1.0.4
#> [37] org.Hs.eg.db_3.12.0  S4Vectors_0.28.1     XVector_0.30.0
#> [40] graph_1.68.0         bit_4.0.4            hms_1.0.0
#> [43] askpass_1.1          png_0.1-7            stringi_1.5.3
#> [46] dplyr_1.0.5          grid_4.0.3           tools_4.0.3
#> [49] bitops_1.0-6         magrittr_2.0.1       RCurl_1.98-1.3
#> [52] RSQLite_2.2.4        tibble_3.1.0         crayon_1.4.1
#> [55] pkgconfig_2.0.3      ellipsis_0.3.1       xml2_1.3.2
#> [58] prettyunits_1.1.1    KEGGgraph_1.50.0     rstudioapi_0.13
#> [61] assertthat_0.2.1     httr_1.4.2           R6_2.5.0
#> [64] compiler_4.0.3


Hello Luo, thank you for your help to resolve the issue. This seemed to have worked well. Would there be a way to include the multiple homolog genes w/ their respective scores? e.g. E2F1,2,3 and E2F4,5 each as separate boxes for E2F1, E2F2, ..., E2F5 ?
Also, thank you for the suggestion of
both.dirs = FALSE. With this setting, however, I've not been able to set "white" be a different number than zero or midpoint b/c of how the color palette is specified in pathview() i.e. f(x) requires low, mid, high colors.Best,