DEXSeq: What's the best way to map an exon counting bin, e.g. E002 to exon(s) or position in transcript(s)
2
0
Entering edit mode
@matmu
Last seen 8 weeks ago
Germany

I have performed differential exon usage with DEXSeq using the corresponding vignette. It worked fine but now I want to investage a hit further, e.g. ENSG00000141510:E002 where E002 refers to an exon counting bin and not necessarily to an exon:

We need to “collapse” this information to define exon counting bins, i.e., a list of intervals, each corresponding to one exon or part of an exon. Counting bins for parts of exons arise when an exonic region appears with different boundaries in different transcripts.

Therefore, one can't simply map E002 to an Ensembl Exon ID and continue the this. I am wondering what is the easiest way to check whether in which transcripts E002 is included and in which region on the transcript or on the respective protein?

DEXSeq • 2.4k views
ADD COMMENT
3
Entering edit mode
Alejandro Reyes ★ 1.9k
@alejandro-reyes-5124
Last seen 5 months ago
Novartis Institutes for BioMedical Rese…

Agree with Wolfgang. In addition, the information of the transcripts that overlap with each bin is in the rowRanges slot of the object. Other package that might be useful is ensembldb. Other helpful functions are exonsBy, transcriptsBy functions, which you could use as subjects in the functions findOverlaps() to find the overlaps with E002.

ensembldb has also great features to map coordinates between genome - transcripts - proteins:

https://bioconductor.org/packages/release/bioc/vignettes/ensembldb/inst/doc/coordinate-mapping.html

ADD COMMENT
0
Entering edit mode

Thanks Alejandro, for the vignette, I think it will do what I want. I will give you feedback as soon as I have tried it.

ADD REPLY
1
Entering edit mode
@wolfgang-huber-3550
Last seen 3 months ago
EMBL European Molecular Biology Laborat…

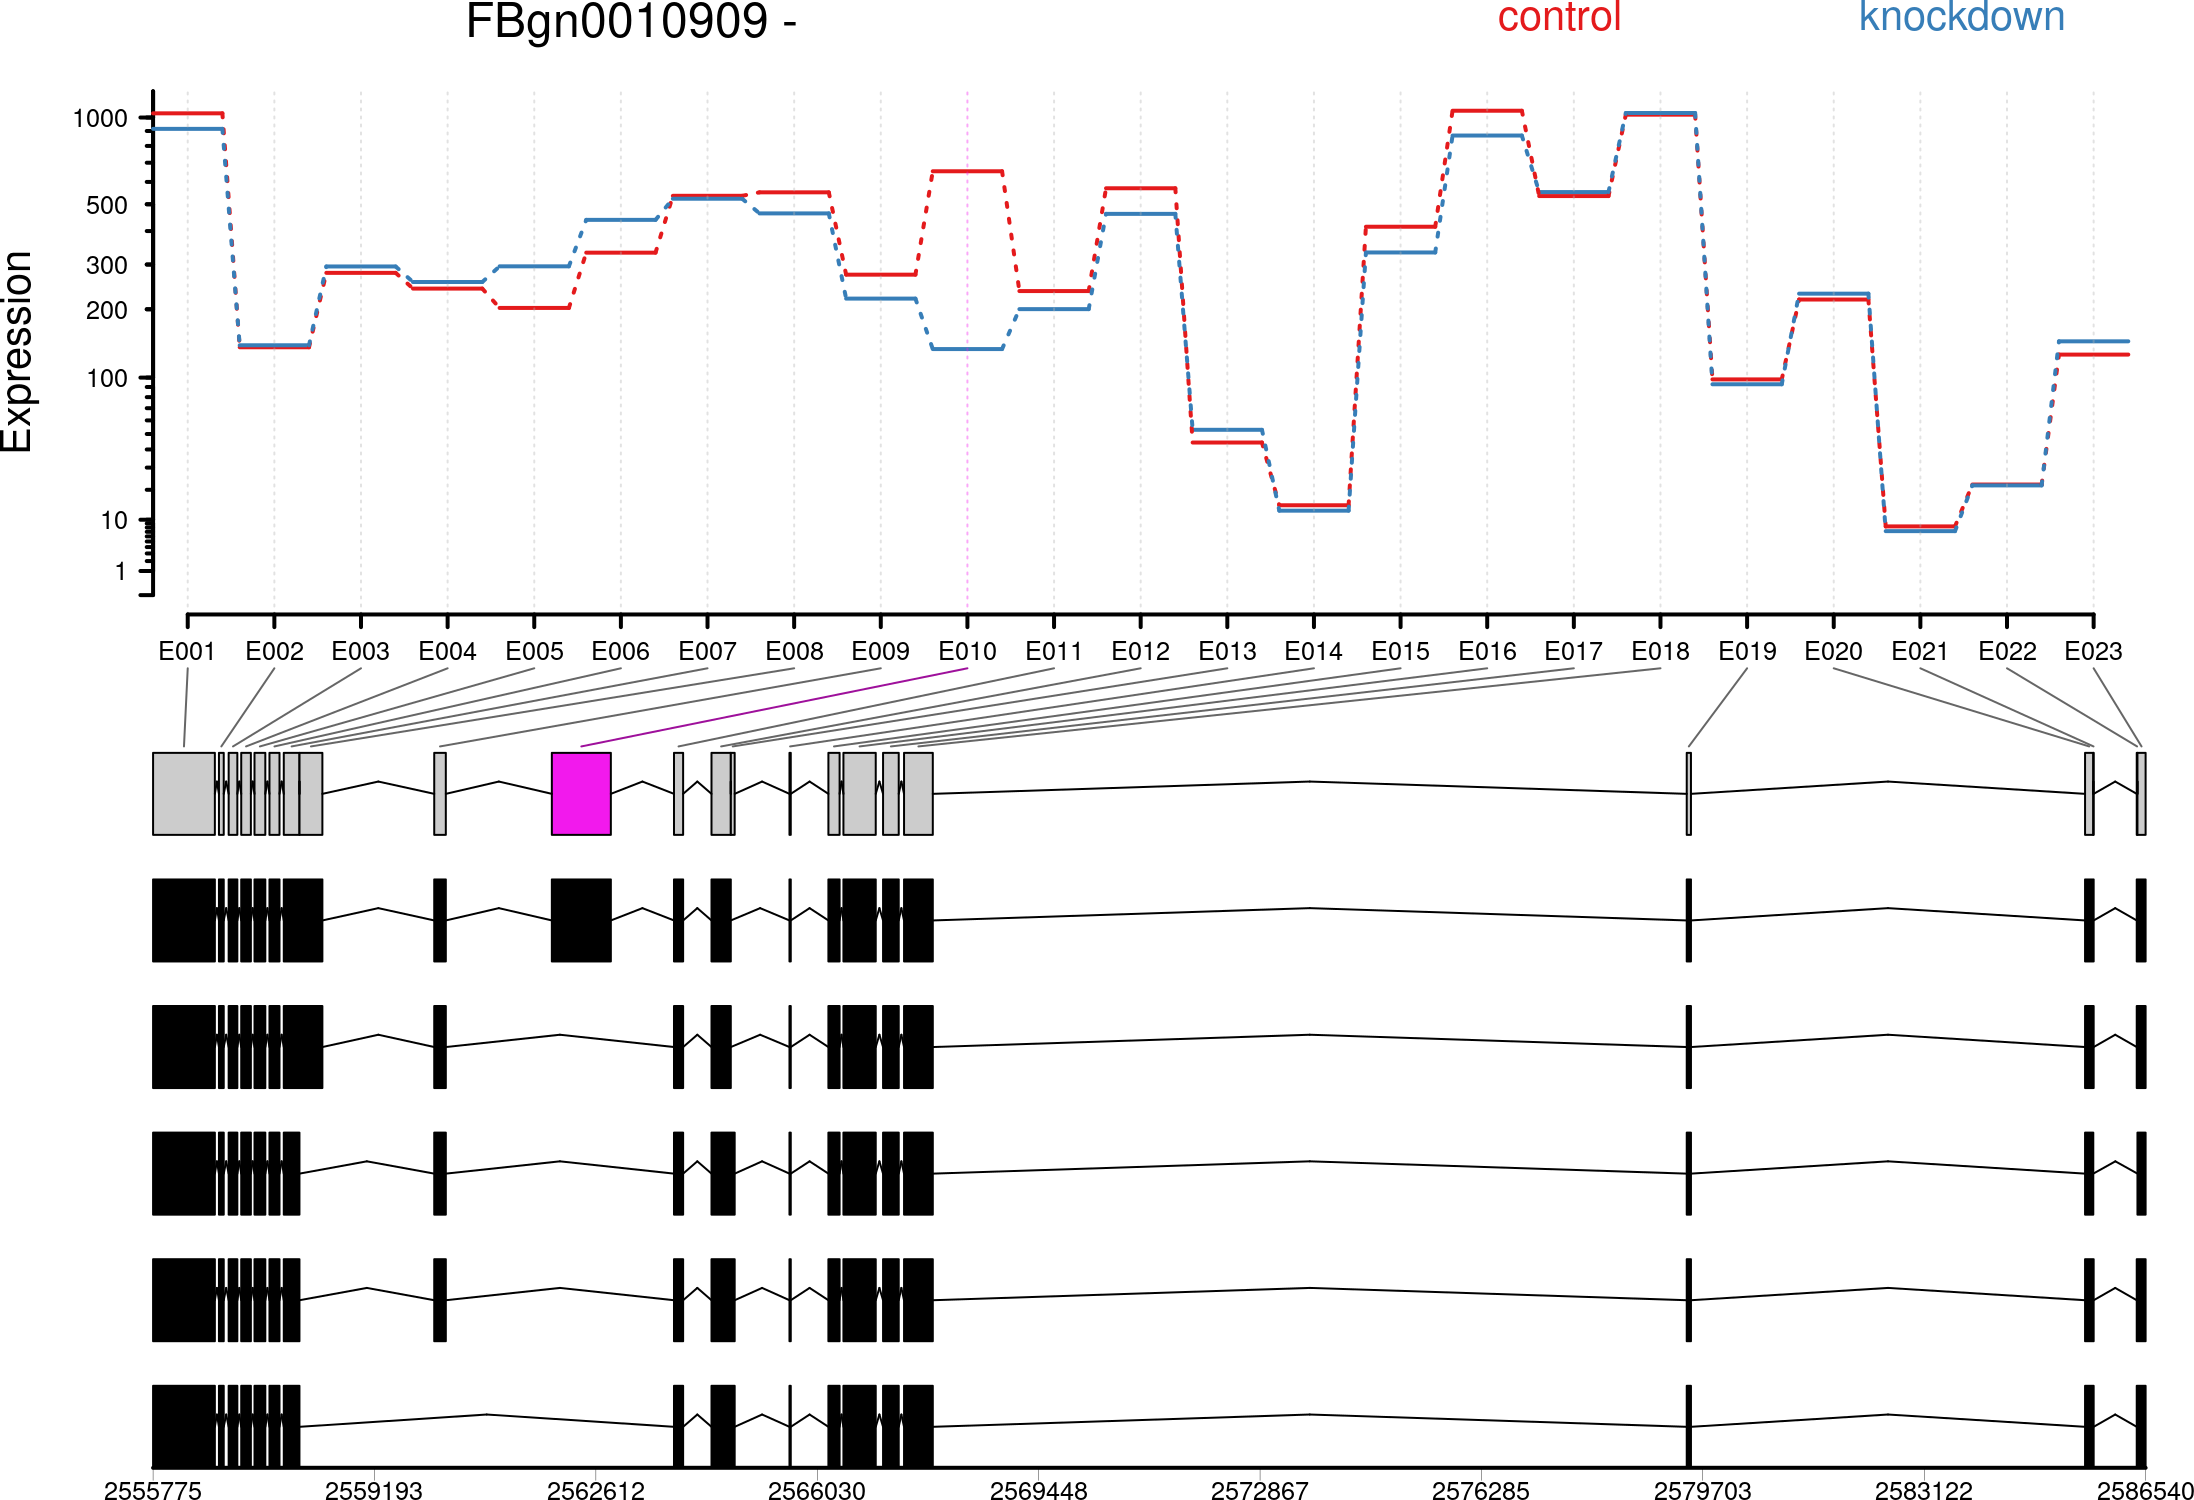
Hi Matthias, does the plotDEXSeq function with displayTranscripts=TRUE as e.g. in https://bioconductor.org/packages/devel/bioc/vignettes/DEXSeq/inst/doc/DEXSeq.html#7_Visualization help you forward?

output of the `plotDEXSeq` function with `displayTranscripts=TRUE`

ADD COMMENT
0
Entering edit mode

Thanks Wolfgang, I saw it in the doc already. When I try to plot the exon usage with displayTranscripts=TRUE, I get "Error in plot.new() : figure margins too large". Any idea how I can avoid this?

ADD REPLY
0
Entering edit mode

I think that should be solved by increasing the size of your plotting device. png(..., height=xx, width=xx). Or just increase the window size of your plotting area if you are using something like Rstudio.

ADD REPLY

Login before adding your answer.

Traffic: 969 users visited in the last hour
Help About
FAQ
Access RSS
API
Stats

Use of this site constitutes acceptance of our User Agreement and Privacy Policy.

Powered by the version 2.3.6