
Hi, I'm using Deseq2 (v1.26.0) and ashr (v2.2-47) to shrink the log2FoldChange of the genes resulting from interaction term. DEseq2 returns the different shrunken log2FoldChanges with (ref) and without (noref) defining the relevels (see below).
More information on experimental side: I have two cell types (cells: WT & Mut) with and without treatment (trt: UT, T). Each contains 3 samples (rep: 1..3). Here are the example files.
I want to identify the genes having response differences of treatment among Mut.T/UT vs WT.T/UT using the following design = ~cell+trt+cell:trt followed by ashr fold-change shrinkage.
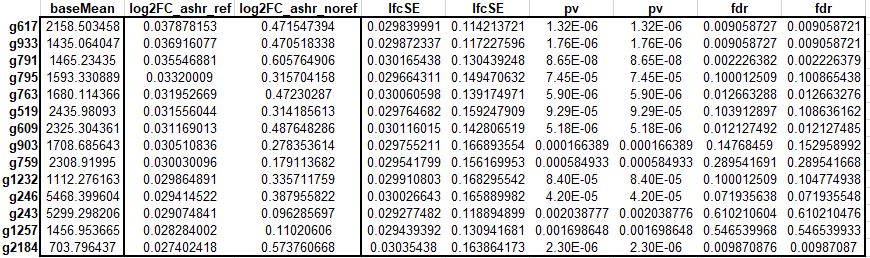
I get different results with ashr with reference levels compared to the ones without defining the reference levels (see above table for example).
My question is "How is it possible to get different log2FC using lfcshrink (ashr) by defining relevels compared to no relevels defining?"
Can someone please help to understand this inconsistency in log2FCs?
Am I doing something wrong (see my code below)?
Any advise in this regards will be greatly appreciated.
Best, Sofia G
Here is the code I used to carry out the analysis:
library(DESeq2)

# load input files
mat = read.table("raw.txt", row.names = 1, header=1, sep="\t")
edf = read.table("edf.txt", row.names = 1, header=1, sep="\t")

# with reference levels
dds <- DESeqDataSetFromMatrix(countData = mat, colData = edf, design = ~cell+trt+cell:trt)
dds$cell <- relevel(dds$cell, "Wt")
dds$trt <- relevel(dds$trt, "UT")
dds <- DESeq(dds, minReplicatesForReplace=Inf)
out <- results(dds, cooksCutoff=FALSE, independentFiltering=FALSE, name="cellMut.trtT")
res = lfcShrink(dds, res=out, coef="cellMut.trtT", type="ashr")

# without reference levels
dds <- DESeqDataSetFromMatrix(countData = mat, colData = edf, design = ~cell+trt+cell:trt)
dds <- DESeq(dds, minReplicatesForReplace=Inf)
out1 = results(dds, cooksCutoff=FALSE, independentFiltering=FALSE, name="cellWt.trtUT")
res1 = lfcShrink(dds, res=out1, coef="cellWt.trtUT", type="ashr")

# merge results generated with and without reference levels
tab1 <- as.data.frame(res)
tab1 <- cbind(gene = rownames(tab1), tab1) # with ref results
tab2 <- as.data.frame(res1)
tab2 <- cbind(gene = rownames(tab2), tab2) # without ref results

final <- plyr::join_all(list(tab1,tab2), by="gene", match = "all")


sessionInfo( )
R version 3.6.1 (2019-07-05)
Platform: x86_64-w64-mingw32/x64 (64-bit)
Running under: Windows 10 x64 (build 19042)

Matrix products: default

locale:
[1] LC_COLLATE=English_United States.1252  LC_CTYPE=English_United States.1252    LC_MONETARY=English_United States.1252
[4] LC_NUMERIC=C                           LC_TIME=English_United States.1252

attached base packages:
[1] parallel  stats4    stats     graphics  grDevices utils     datasets  methods   base

other attached packages:
 [1] DESeq2_1.26.0               SummarizedExperiment_1.16.1 DelayedArray_0.12.3         BiocParallel_1.20.1
 [5] matrixStats_0.58.0          Biobase_2.46.0              GenomicRanges_1.38.0        GenomeInfoDb_1.22.1
 [9] IRanges_2.20.2              S4Vectors_0.24.4            BiocGenerics_0.32.0         dplyr_0.8.3

loaded via a namespace (and not attached):
 [1] bit64_4.0.5            splines_3.6.1          Formula_1.2-4          assertthat_0.2.1       mixsqp_0.3-43          latticeExtra_0.6-30
 [7] blob_1.2.1             GenomeInfoDbData_1.2.2 pillar_1.5.1           RSQLite_2.2.5          backports_1.2.1        lattice_0.20-38
[13] glue_1.4.2             digest_0.6.27          RColorBrewer_1.1-2     XVector_0.26.0         checkmate_2.0.0        colorspace_2.0-0
[19] htmltools_0.5.1.1      Matrix_1.2-17          plyr_1.8.6             XML_3.99-0.3           pkgconfig_2.0.3        invgamma_1.1
[25] genefilter_1.68.0      zlibbioc_1.32.0        purrr_0.3.3            xtable_1.8-6           scales_1.1.1           jpeg_0.1-8.1
[31] htmlTable_2.1.0        tibble_2.1.3           annotate_1.64.0        ggplot2_3.3.3          ellipsis_0.3.1         cachem_1.0.4
[37] ashr_2.2-47            nnet_7.3-12            survival_3.2-10        magrittr_2.0.1         crayon_1.4.1           memoise_2.0.0
[43] fansi_0.4.2            truncnorm_1.0-8        foreign_0.8-72         tools_3.6.1            data.table_1.13.6      lifecycle_1.0.0
[49] stringr_1.4.0          locfit_1.5-9.4         munsell_0.5.0          irlba_2.3.3            cluster_2.1.0          AnnotationDbi_1.48.0
[55] compiler_3.6.1         rlang_0.4.10           grid_3.6.1             RCurl_1.98-1.3         rstudioapi_0.13        htmlwidgets_1.5.3
[61] bitops_1.0-6           base64enc_0.1-4        gtable_0.3.0           DBI_1.1.1              R6_2.5.0               gridExtra_2.3
[67] knitr_1.31             fastmap_1.1.0          bit_4.0.4              utf8_1.2.1             Hmisc_4.5-0            stringi_1.5.3
[73] SQUAREM_2021.1         Rcpp_1.0.3             geneplotter_1.64.0     vctrs_0.3.7            rpart_4.1-15           png_0.1-8
[79] tidyselect_0.2.5       xfun_0.22

Hi Michael - thank you for your reply. Is this explain in the vignettes?
It's not a simple explanation, and we don't talk about it in the vignettes I believe, but it's just the case that penalized regression is not always symmetric across change in the reference levels.
What happens if you plot
out$log2FoldChangevsres$log2FoldChangefor ref and no ref? Do those plots look similar?