Dear community,
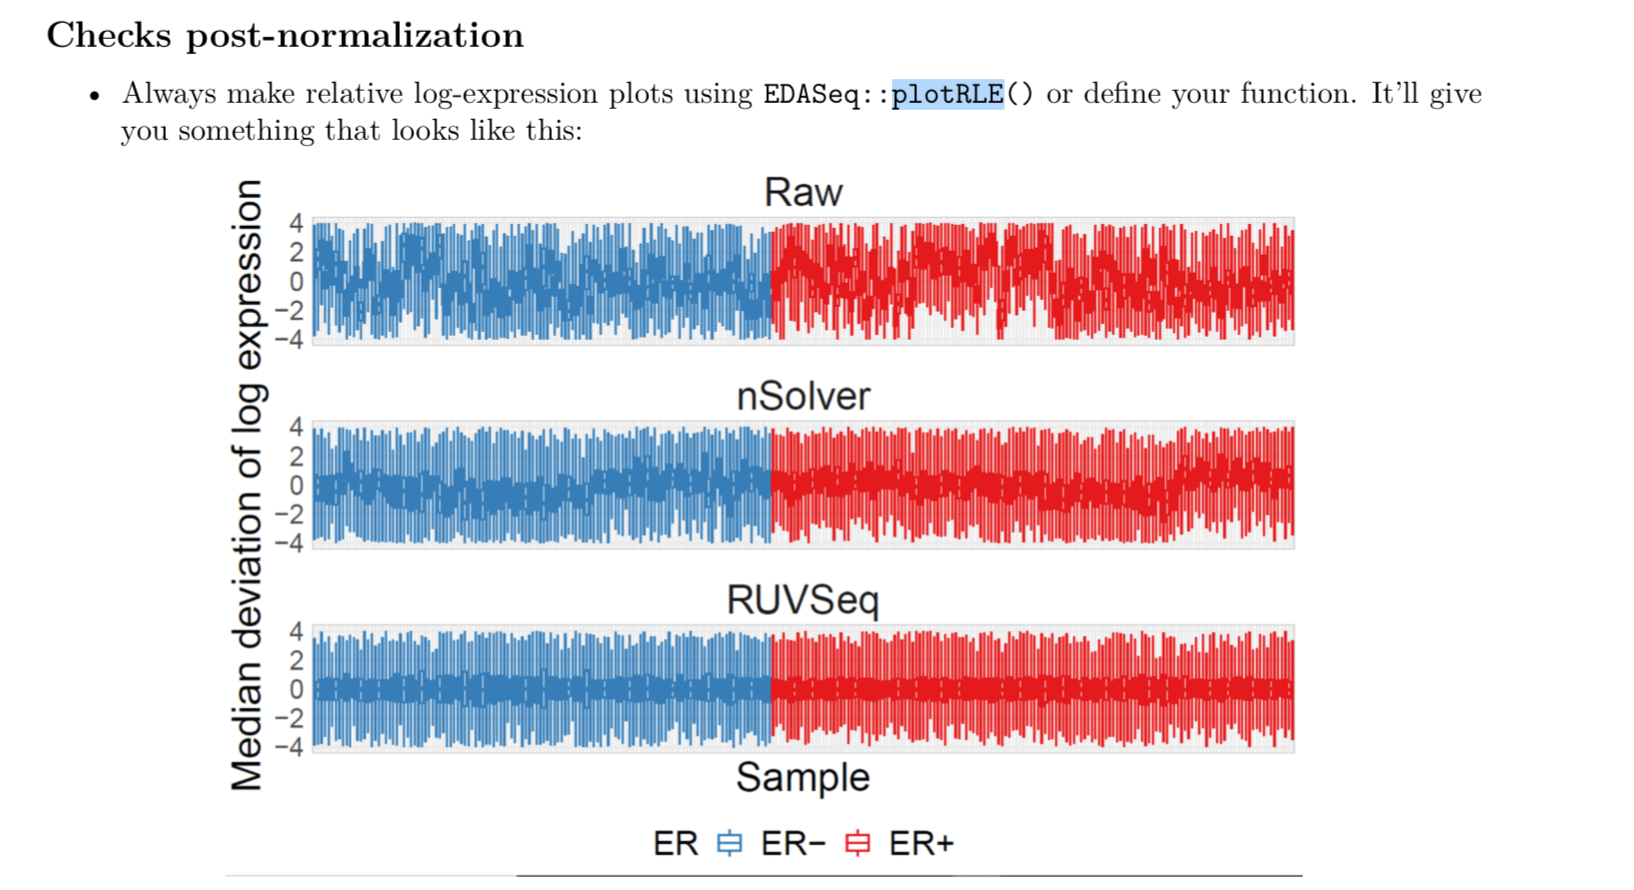
How to use plotRLE() to plot multiple figures on same page and also only one legend, one x-axis and y-axis title, like this
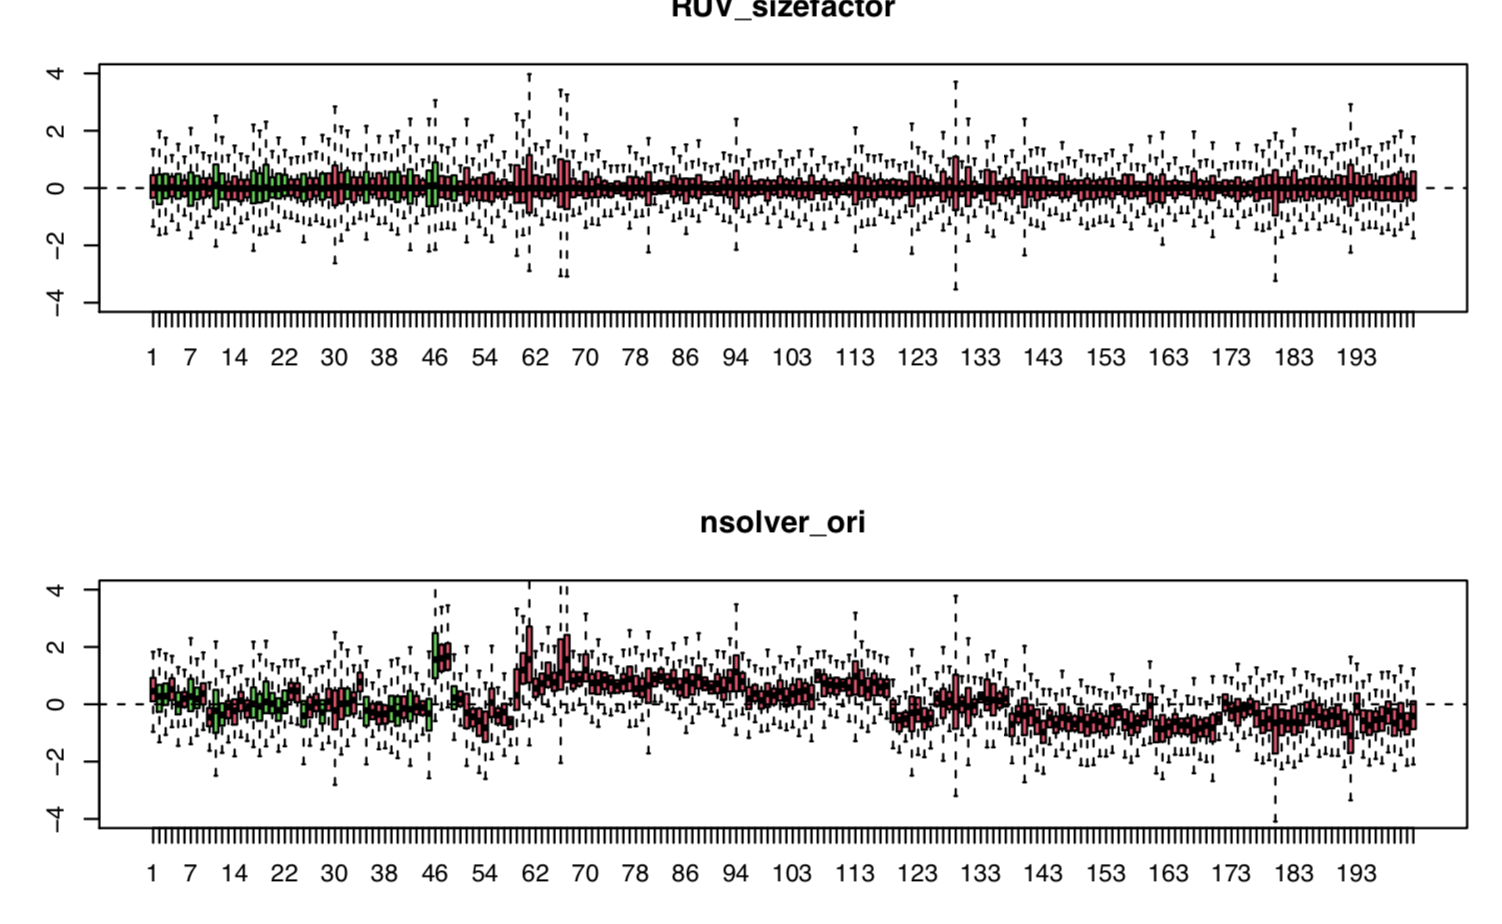
I can use the codes below to put them in same plot, but not condensed as above.
par(mfrow = c(3,1))
plotRLE(data_ruv, outline=FALSE, col= rle_col, main="RUV_sizefactor", names=NULL, ylim=c(-4, 4))
plotRLE(data_nsolver_ori, outline=FALSE, col= rle_col, main="nsolver_ori", names=NULL, ylim=c(-4, 4))


@James W. MacDonald Thank you so much for your time and answer!
It is much more condensed by adjusting the margin. But, I remembered it should be adjusted or managed by ggplot to put multiple figures on same page using same x-axis and y-axis. I can't remember where is the thread to discuss about that. I will try to search more.
Here is where it comes from https://github.com/bhattacharya-a-bt/CBCS_normalization/blob/master/CBCS_normalization_tutorial.pdf
I did't find the code to generate it.
Yeah, it was probably done using ggplot2. Which is not a Bioconductor package, and which has lots of other help elsewhere.
Thanks a lot!
https://github.com/bhattacharya-a-bt/CBCS_normalization/blob/master/sample_rle_code.R