Entering edit mode

Can anyone suggest me how does the tool assign the 100kb region into the promoter region. I know the distance is calculated from TSS. However, I do not understand how was the promoter region assigned to 100kb regions? I have the sample file attached here.
I used the following function in r to do the annotation
Code should be placed in three backticks as shown below
overlaps.anno <- annotatePeakInBatch(gr3, AnnotationData=annoData  , output="both")

  aCR<-assignChromosomeRegion(gr3, nucleotideLevel=FALSE,
                              precedence=c("Promoters", "immediateDownstream",
                                           "fiveUTRs", "threeUTRs",
                                           "Exons", "Introns"),
                              TxDb=TxDb.Hsapiens.UCSC.hg19.knownGene)


# include your problematic code here with any corresponding output
# please also include the results of running the following in an R session

sessionInfo( )
Hi Arunima,
Can you post the output of your sesssionInfo() and let us know the annoData that you used? The output from annotatePeakInBatch should include additional information such as distance information.
I suggest you set set PeakLocForDistance = "endMinusStart" for strand-specific annotation. With this parameter setting, the end of the peak will be used for calculating the distance to features on plus strand and the start of the peak will be used for calculating the distance to features on minus strand.
Please type ?annotatePeakInBatch for more detailed description of other parameters.
Best regards,
Julie
Hi Julie
I tried to set PeakLocForDistance = "endMinusStart" , but it shows error. It allows me to either use c("start, middle or end"). It does not give me option to use "endMinusStart".
Thanks Arunima
Hi Arunima,
This option is available for >= version 3.26 . Please download the newest version at https://bioconductor.org/packages/release/bioc/html/ChIPpeakAnno.html
Best regards,
Julie
Hi Julie
Thank you so much for your response. I was able to update R and re-install the package. I used the code to annotate the 100kb region and the graph is attached below.
genomicElementDistribution(gr3,
                           TxDb = TxDb.Hsapiens.UCSC.hg19.knownGene,
                           promoterRegion=c(upstream=2000, downstream=500),
                           geneDownstream=c(upstream=0, downstream=2000))
I have the following question regarding the graph below. The regions have grouped into 3 different classes as gene-level, exon/intron/intergenic and exon level.
How is exon level defined?
The gene level is further grouped as promoter, downstream and gene body.
What does gene body mean ?
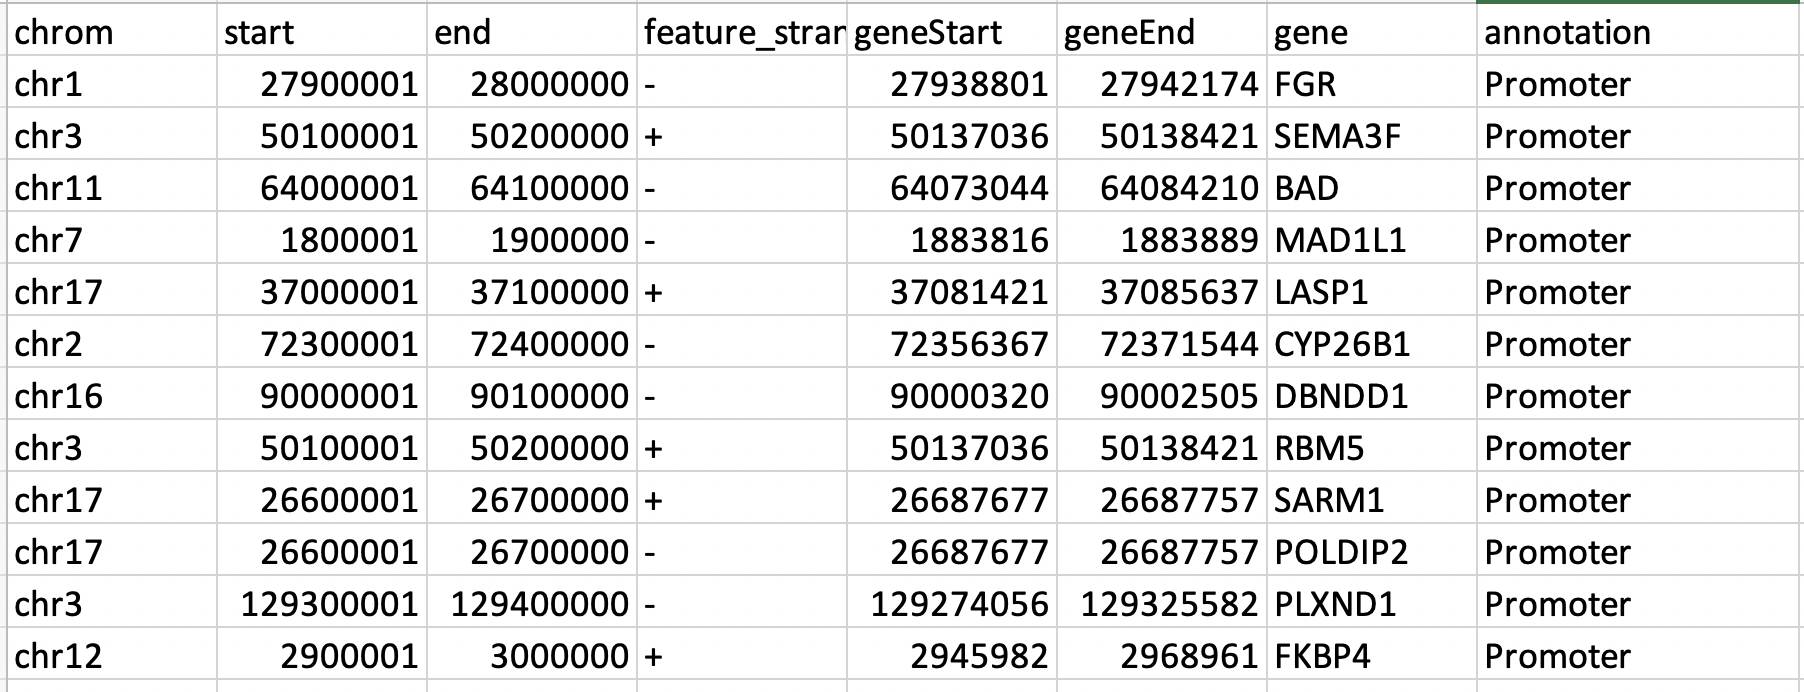
I just have one last question. How does the tool annotates the peaks associated with the promoter region of gene ? I am trying to annotate 100 kb region. In the figure below , the FGR gene has been annotated as promoter from the peak. It not only includes the promoter regions but it also other regions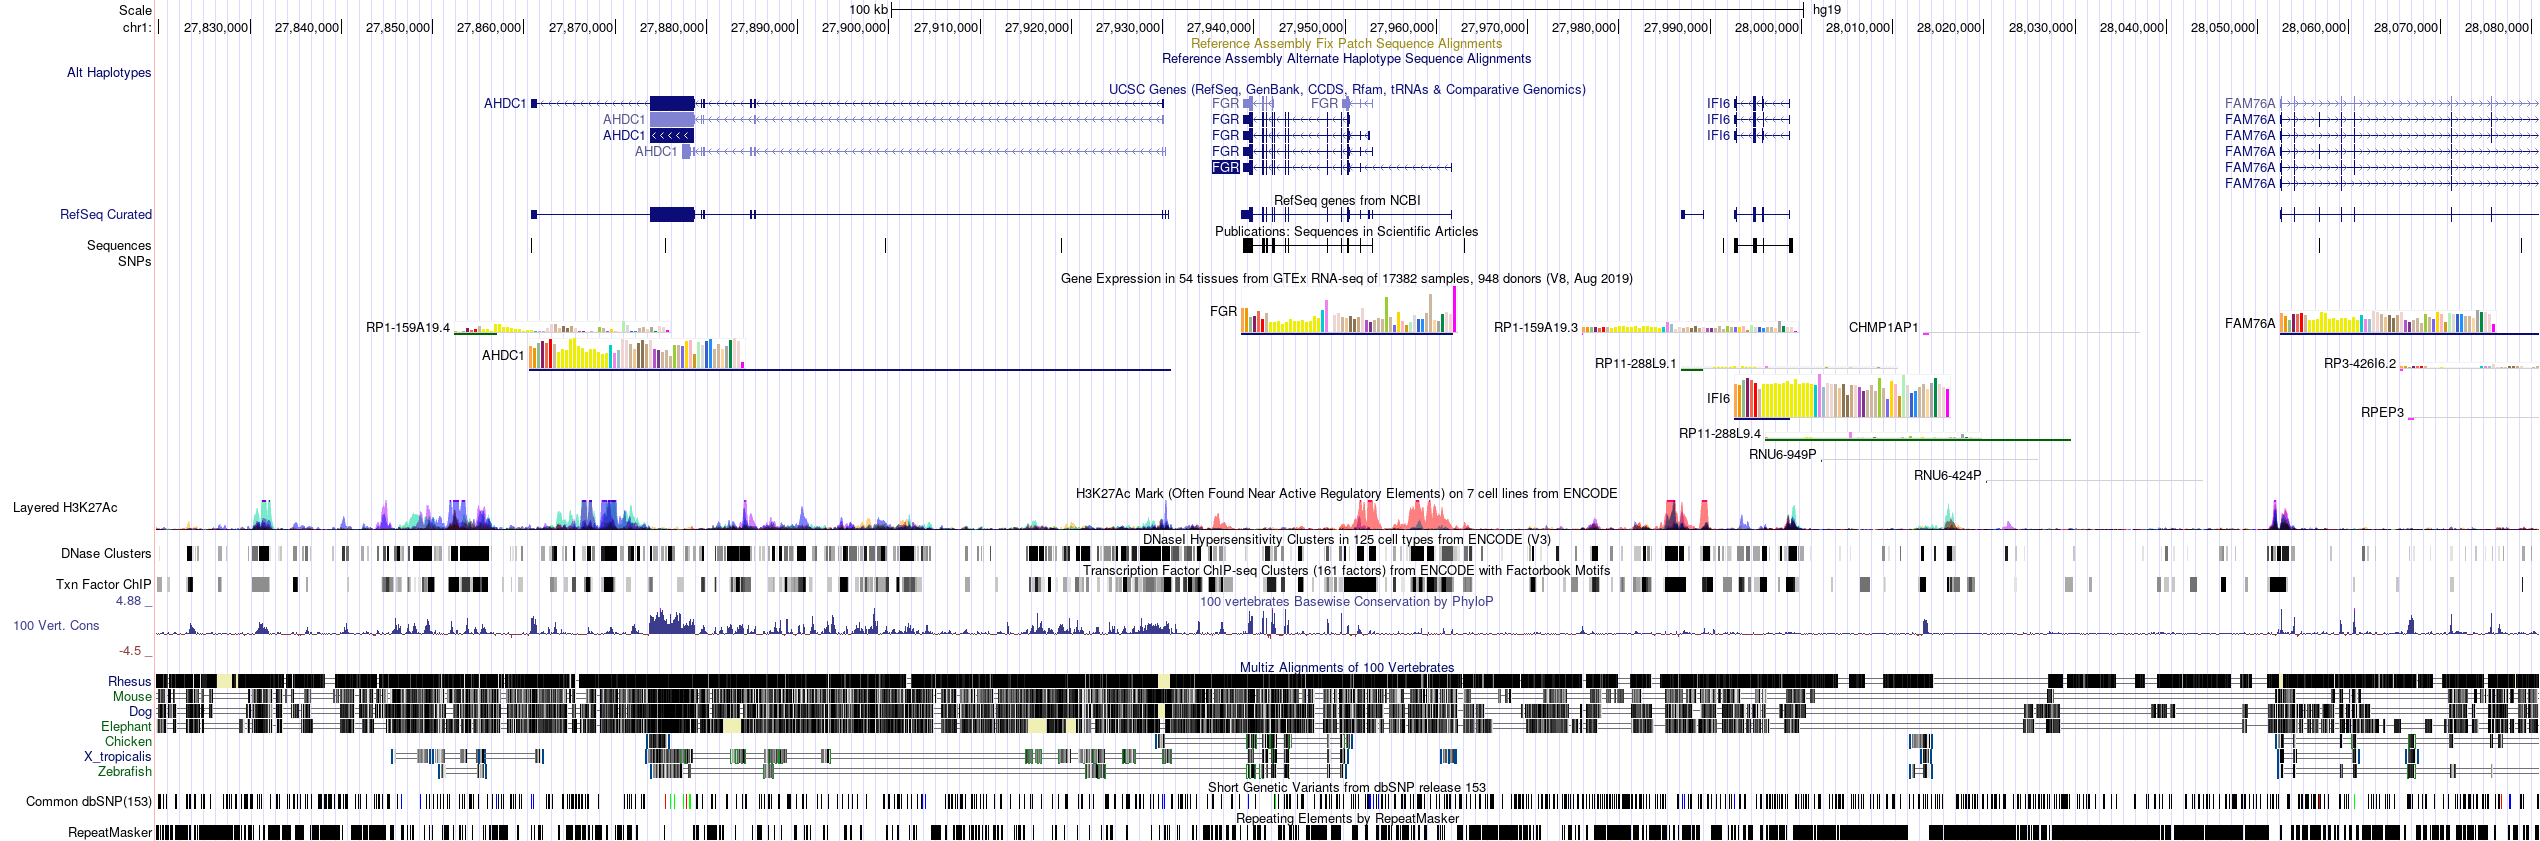 .
.
Thanks Arunima
Hi Arunima,
All the annotation information and definition are provided by the input. For example, The Txdb you provided has definition of exon/intron/gene/TSS. The other parameters such as promoterRegion and downstream specify the promoter region, downstream and gene body.
In your example, you defined a promoter region as a region between 2000 bp upstream and 500 bp downstream of TSS.
Best regards,
Julie
Hello Dr. Juli
Thank you so much for your response. It is indeed very helpful tool for the annotation. The table attached gives much clear understanding to the annotation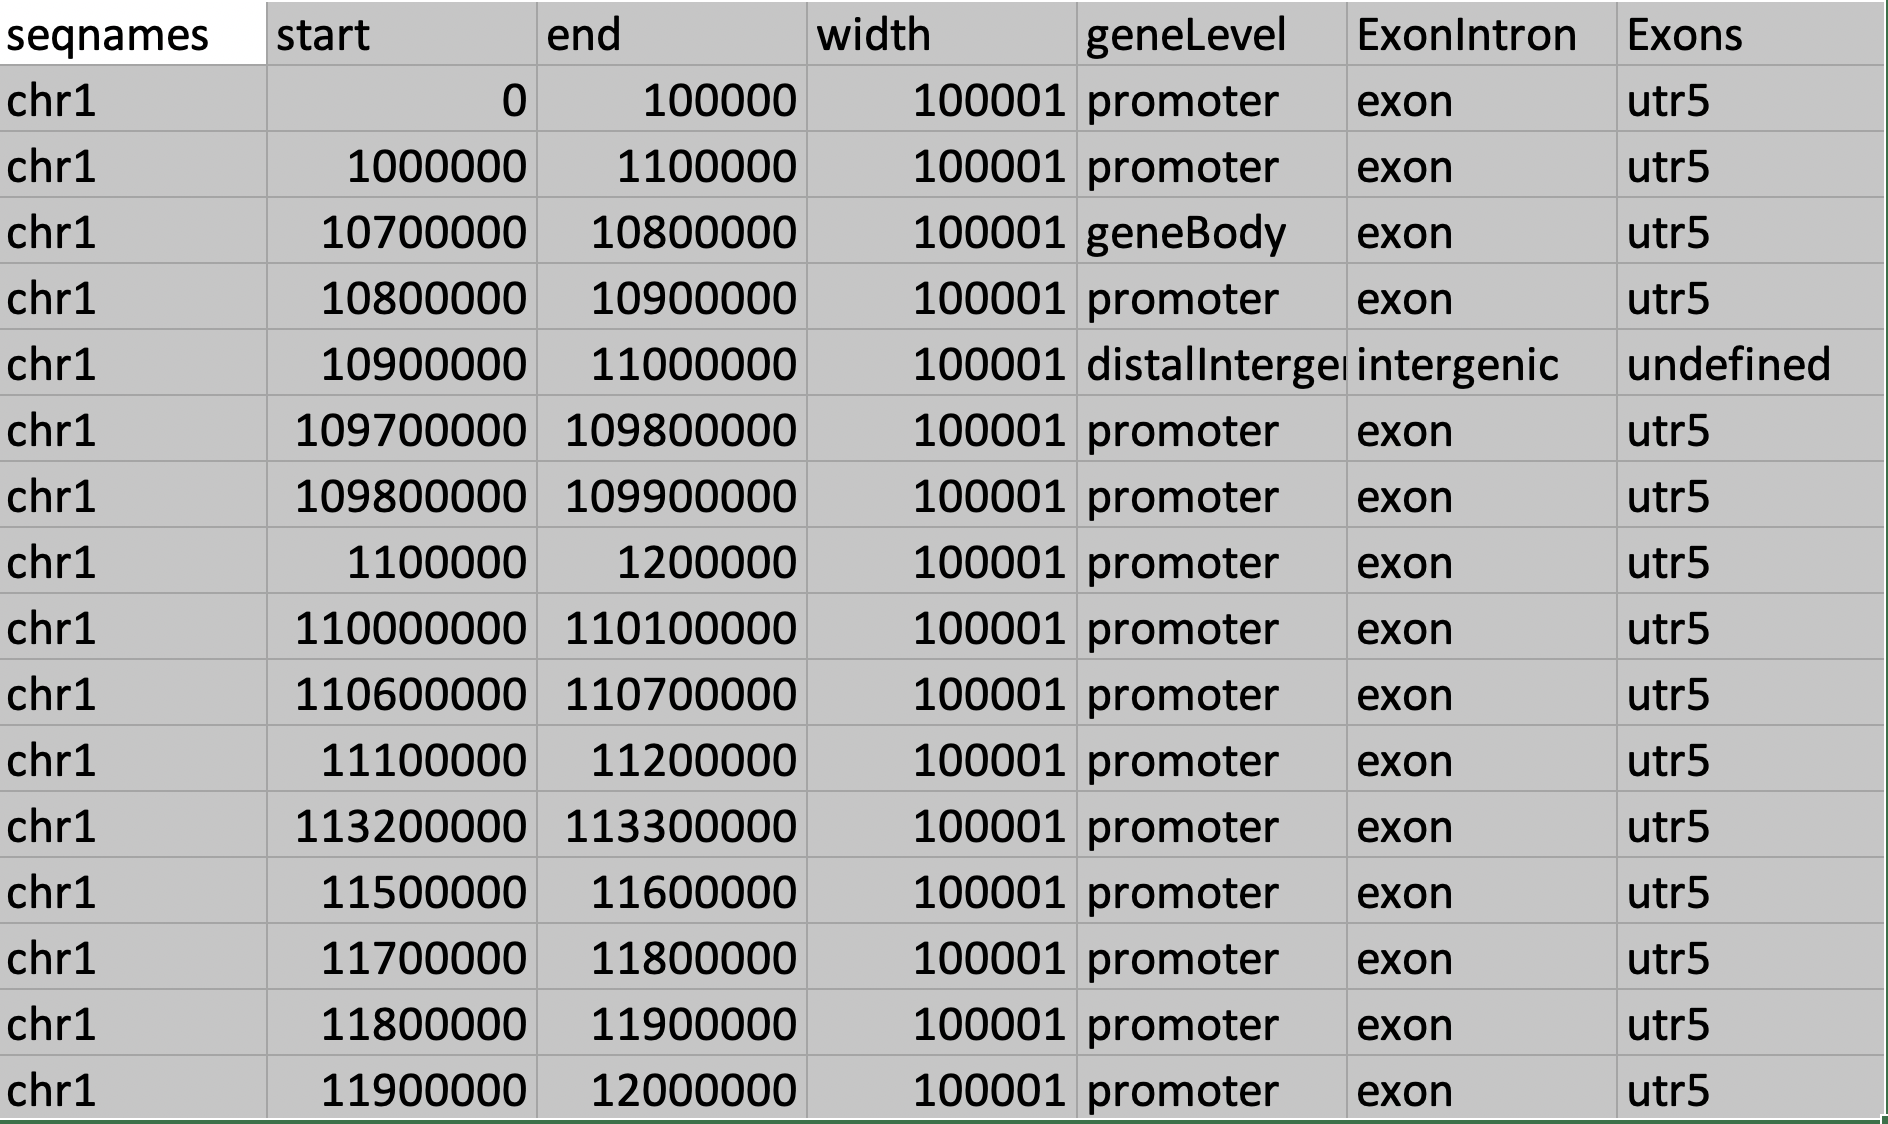 .
.
Arunima