
Hi, I'm using admixMap in GENESIS package to do admixture mapping (binary trait). Local ancestry was called by RFmix (only 2 reference ancestry actually), each loci is assigned either "afr" or "eur".
I tried following models: phenotype ~ age, sex, bmi (with GRM as cov.mat)
phenotype ~ age, sex, bmi, global ancestry (with GRM as cov.mat)
phenotype ~ age, sex, bmi, PC1-4 (with GRM as cov.mat)
phenotype ~ age, sex, bmi (only include unrelated individuals, without GRM as cov.mat)
phenotype ~ age, sex, bmi, global ancestry (only include unrelated individuals, without GRM as cov.mat)
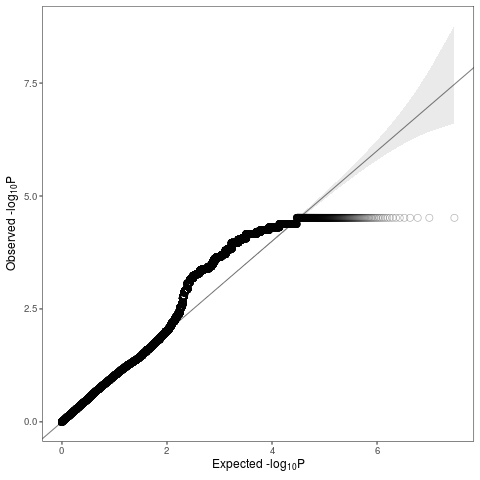
But all my QQplots look deflated at tail and inflated in the middle.
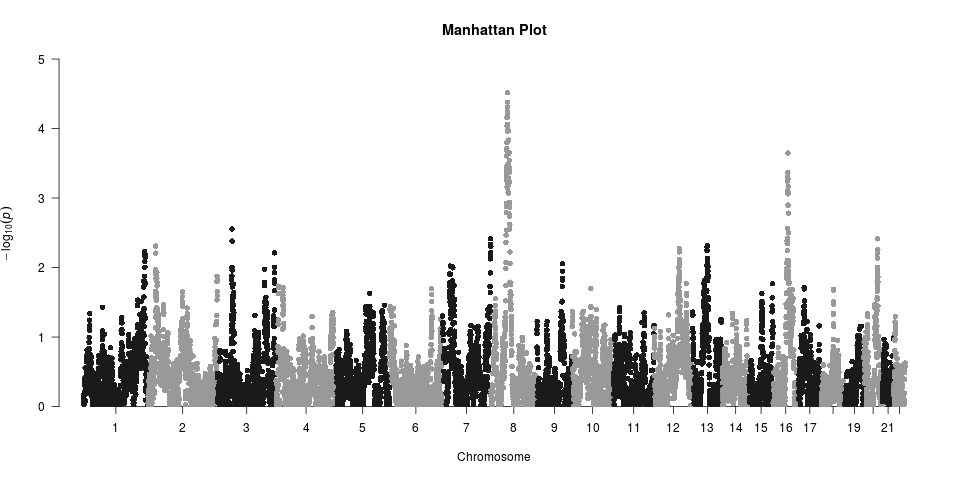
The inflated bump comes from chr8 and chr16, where the peaks are. But I don't understand why the tail is deflated. Could anyone make some suggestions?
Also another side question: Since I only have 2 reference for local ancestry calls, is admixMap() the same as assocTestSingle() in that case? So the local ancestry call would be treated as bi-allelic genotype in GWAS. The only difference is admixMap() uses Wald test and assocTestSingle() uses Score test, is it correct? I compared 2 methods and the result looks almost identical.