Entering edit mode

It would be helpful, if the axis labels of plotPCA() in affycoretools would include the
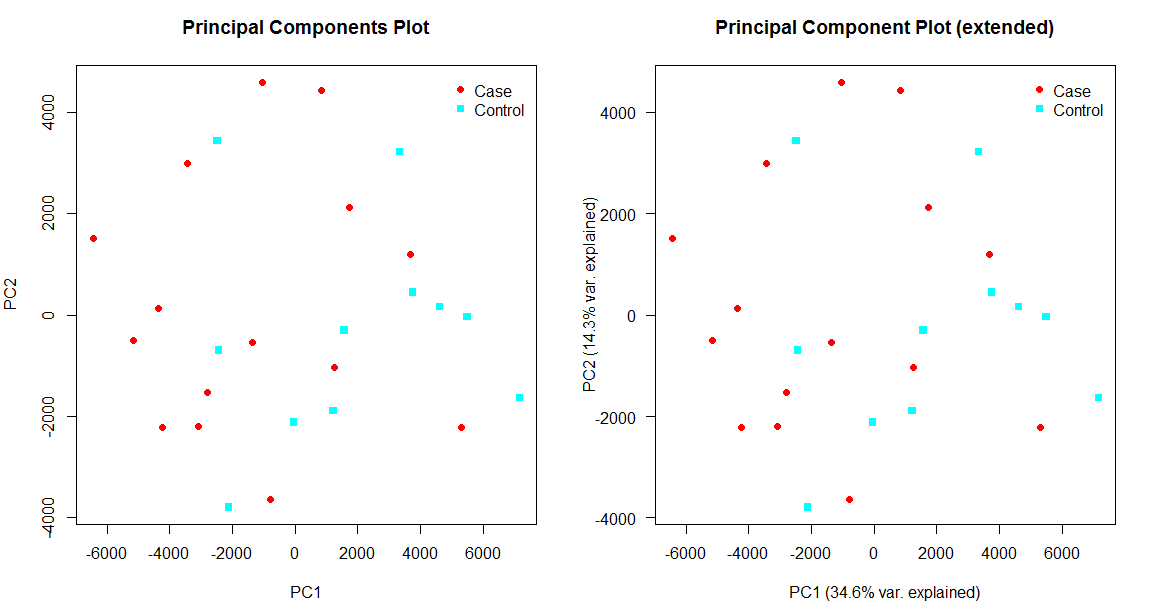
percentage of variance explained for the selected principal components.
Furthermore, the y-axis labels could be rotated by default and the pca object could be returned
as the result of plotPCA().
The current version and a possible extended version of the output of plotPCA() are shown below:
Working example:
  library(affycoretools)

  data(sample.ExpressionSet)
  eset <- sample.ExpressionSet
  stype <- pData(eset)$type
  eset.pca <- plotPCA(eset, groups=as.numeric(stype), groupnames=levels(stype))
R and Bioconductor environment:
R version 4.1.2 (2021-11-01)
Platform: x86_64-w64-mingw32/x64 (64-bit)
Running under: Windows 7 x64 (build 7601) Service Pack 1

locale:
[1] LC_COLLATE=English_United Kingdom.1252  LC_CTYPE=English_United Kingdom.1252
[3] LC_MONETARY=English_United Kingdom.1252 LC_NUMERIC=C
[5] LC_TIME=English_United Kingdom.1252

attached base packages:
[1] stats     graphics  grDevices utils     datasets  methods   base

other attached packages:
[1] affycoretools_1.66.0 Biobase_2.54.0       BiocGenerics_0.40.0
