
Hi all,
I'm new to limma and voom and have been trying to wrap my head around the pipeline with my RNA-Seq data. My question does not concern code as such but more that I have understood correctly how the voom function works. And therefore I would like to ask if my logic below is correct. I have time-dependent data which is individual samples collected at 4 different developmental stages and across 3 different genotypic backgrounds. I have biologcal 3 replicates per each genotype-stage group. Biologically there is alot of expression changes going on the tissue across time for a single gene and I'm interested in the differential expression between stages due to genotype.
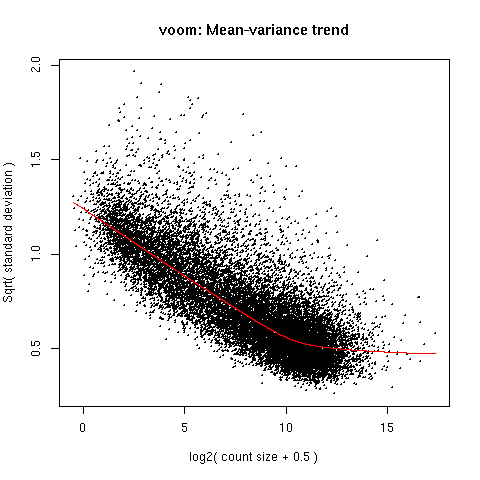
When applying the voom on my data (after filtering for low counts and TMM normalisation) I have given my desing matrix so the per gene variance which is plotted in the voom:mean-variance plot represents the residual variance in the gene across my whole data. Then the residual variance is plotted against the gene mean for all the gene in my data. Then to get the weighing values each observation of a gene is transformed to a predicted count value (calculated based on the lib size) which is then used to get the standard deviation for the observation using the mean-variance trend line. So does the observation in this case correspond to the TMM-normalised logCPM value of given gene in my samples?
Similar to the voom plots in Figure 1E in Law et al 2014 (the Drosophila development RNA-Seq data) I have a large cloud and large variance for the small mean log2 but also large clustering of low variance around log2 of 10. Genes of samples which have a high standard deviation and are far from the trend line will have a large weighing factor, correct? Will there be any bias for the estimation of significance due to a genes logCPM being "far" from the trend line?
All the best, Heidi Viitaniemi
> GroupT
 [1] st1AA st1AA st1AA st1AB st1AB st1BB st1BB st2AA st2AA st2AA st2AB st2AB st2AB st2BB st2BB st3AA st3AA st3AA st3AB st3AB st3BB st3BB st3BB st4AA st4AA st4AA
[27] st4AB st4AB st4AB st4BB st4BB st4BB
Levels: st1AA st1AB st1BB st2AA st2AB st2BB st3AA st3AB st3BB st4AA st4AB st4BB

>designT <- model.matrix(~0+GroupT)
>colnames(designT) <- levels(GroupT)
>designT
        st1AA st1AB st1BB st2AA st2AB st2BB st3AA st3AB st3BB st4AA st4AB st4BB
SKO186T     1     0     0     0     0     0     0     0     0     0     0     0
SKO187T     1     0     0     0     0     0     0     0     0     0     0     0
SKO201T     1     0     0     0     0     0     0     0     0     0     0     0
SKO223T     0     1     0     0     0     0     0     0     0     0     0     0
.

>v_data <- voom(dge3,designT,plot=TRUE)

Thank you Gordon for your response, this helps me a lot.
I think I was a bit stuck on the way regeression is looked at and therefore was thinking of the distance of a single point to the trendline as it is drawn in the Figure 2 in Law et al (2014). The term observation is perhaps what I did not fully understood the meaning of. I understood that the observation is a single gene from a single sample but my view was sample centered when looking at the trend plot instead of gene centered. I'll have a new read of Law et al (2014) with your response on my mind and a new look on my data after that.