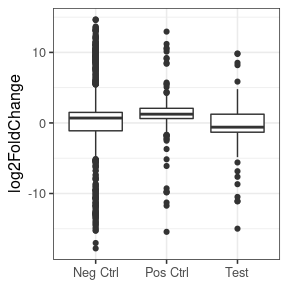
I am analysing an two condition RNAseq dataset and would like to address questions around the behaviour of sets of transcripts. I am particularly interested in whether particular transcript sets have the tendency to be up or down regulated, as a group. As part of my analysis (in DESeq2) I have applied lfcShrink to shrink the log2FoldChanges.
If I look at my positive controls, I see that there are more significantly upregulated than down regulated (using an svalue for cutoff, with an lfcThreshold of 0.32). If I look at my negatives controls I see equal significantly up and down, and if I look at the gene set i'm interested in, I also see equal up and down.
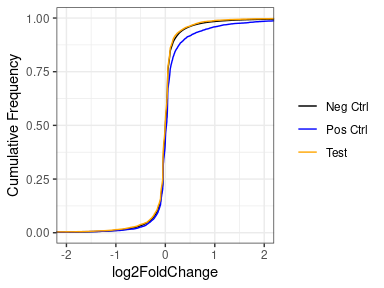
However, if we put aside the significance or a moment, and look at just the log2FoldChanges of the whole set, we see that basically for all, the vast majority are unchanged, with a very strong peak at zero in all three sets (negative, positive and test set). If we look closely at the positive set, we see that the distribution of the positives does deviate slightly from the negatives, with a slight enrichment of things with an LFC > 0.
Concluding that my treatment DOESN'T increase the expression of my test set would be an unexpected and exciting finding - the null hypothesis would be that they behave like the positive controls, but I can't help wonder if i'm biasing towards this finding by using lfcShrink.
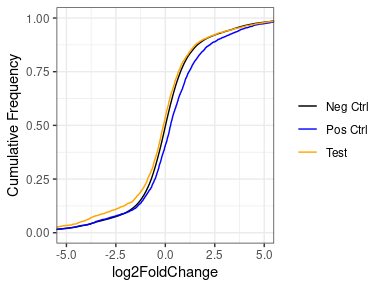
If I look at the same thing without lfcShink, there is a much bigger difference. But here I'm worried that this might be caused by the expression of the test set being lower than the positive or negative sets.
Does anyone have any thoughts on whether shrinkage of LFCs is the correct thing to do here?


Thanks Mike. I might have a play with stratifying by expression level.
One reason I wasn't looking at gene set testing is that its the null results that is interesting. One would naively expect this set of genes to change, and they aren't doing, and the fact they aren't is what might point to new biology. Which is obviously super hard to demonstrate. I might also look into using an alternative hypothesis of |lfc| < x, but I'm not sure I'll have the power.