
Hi, I am curious about prefiltering with DESeq2. I understand from this site and reading the DESeq2 vignette that prefiletering is really unnecessary as DESeq2 has a stringent filtering that it does. However, I'm seeing better results with filtering (much higher # DEGs with sig adj p-value after DESeq2).
I have a one factor design and three samples in two different groups. I do have a sample that's a bit noisier than the others but doesn't seem there is any significant grounds to remove it. With prefiltering, I find the highest number of significant DEGs when I filter out anything below 50 normalized counts for each of the six samples.
My question is, is this wrong? Is creating such a high prefiltering cutoff affecting my false positivity rate somehow? Though I love that I get triple the amount of significant DEGs, I don't want to go down the wrong path in my subsequent pathway analsyis due to a prefiltering error.
Thank you for your time.
My code
#dds <- DESeqDataSetFromMatrix(countData=countdata, colData=sampleData, design = ~ condition, tidy= FALSE)
#dds <- estimateSizeFactors(dds)
#keep <- rowSums(counts(dds, normalized=TRUE) >= 50 ) >=6
#dds <- dds[keep,]
#dds <- DESeq(dds)


sessionInfo( )
R version 4.1.2 (2021-11-01)
Platform: x86_64-w64-mingw32/x64 (64-bit)
Running under: Windows 10 x64 (build 19044)

Matrix products: default

locale:
[1] LC_COLLATE=English_United States.1252
[2] LC_CTYPE=English_United States.1252
[3] LC_MONETARY=English_United States.1252
[4] LC_NUMERIC=C
[5] LC_TIME=English_United States.1252

attached base packages:
[1] stats4    stats     graphics  grDevices utils     datasets  methods
[8] base

other attached packages:
 [1] dplyr_1.0.8                 DESeq2_1.34.0
 [3] SummarizedExperiment_1.24.0 Biobase_2.54.0
 [5] MatrixGenerics_1.6.0        matrixStats_0.61.0
 [7] GenomicRanges_1.46.1        GenomeInfoDb_1.30.1
 [9] IRanges_2.28.0              S4Vectors_0.32.3
[11] BiocGenerics_0.40.0         BiocManager_1.30.16

loaded via a namespace (and not attached):
 [1] locfit_1.5-9.4         Rcpp_1.0.8             lattice_0.20-45
 [4] png_0.1-7              Biostrings_2.62.0      assertthat_0.2.1
 [7] utf8_1.2.2             R6_2.5.1               RSQLite_2.2.9
[10] httr_1.4.2             ggplot2_3.3.5          pillar_1.7.0
[13] zlibbioc_1.40.0        rlang_1.0.1            rstudioapi_0.13
[16] annotate_1.72.0        blob_1.2.2             Matrix_1.3-4
[19] splines_4.1.2          BiocParallel_1.28.3    geneplotter_1.72.0
[22] RCurl_1.98-1.6         bit_4.0.4              munsell_0.5.0
[25] DelayedArray_0.20.0    compiler_4.1.2         pkgconfig_2.0.3
[28] tidyselect_1.1.2       KEGGREST_1.34.0        tibble_3.1.6
[31] GenomeInfoDbData_1.2.7 XML_3.99-0.8           fansi_1.0.2
[34] crayon_1.5.0           bitops_1.0-7           grid_4.1.2
[37] xtable_1.8-4           gtable_0.3.0           lifecycle_1.0.1
[40] DBI_1.1.2              magrittr_2.0.2         scales_1.1.1
[43] cli_3.1.1              cachem_1.0.6           XVector_0.34.0
[46] genefilter_1.76.0      ellipsis_0.3.2         vctrs_0.3.8
[49] generics_0.1.2         RColorBrewer_1.1-2     tools_4.1.2
[52] bit64_4.0.5            glue_1.6.1             purrr_0.3.4
[55] parallel_4.1.2         fastmap_1.1.0          survival_3.2-13
[58] AnnotationDbi_1.56.2   colorspace_2.0-2       memoise_2.0.1
>

Wonderful. Thank you so much for the speedy response! It's much appreciated.
Out of curiosity (since I'm quite a newbie to bioinformatics and DESeq2): In explaining my methods pipeline and DESeq2 results, is there a good way to plot as a visual the possibility of "a lot of high dispersion low count features that are changing the dispersion trend" that could give reason to pre-filtering?
If I do NOT prefilter low counts, perform DEseq, then look at a dispersion plot and a histogram of ratios of low p-value vs. mean count, it seems normal I think?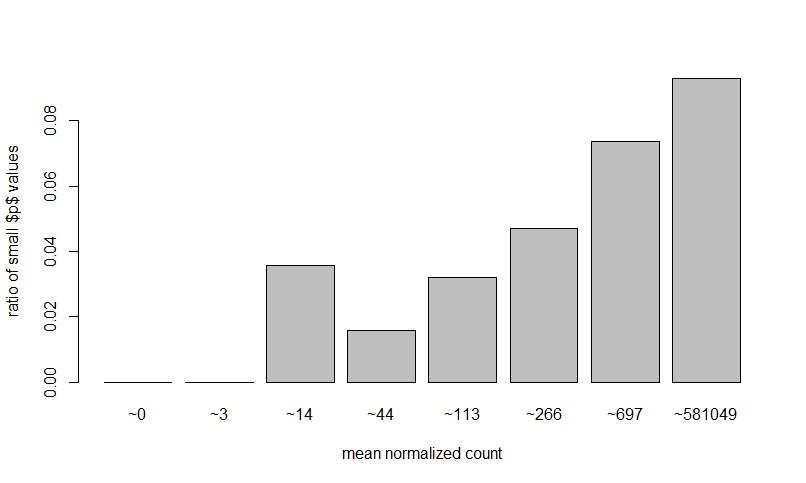
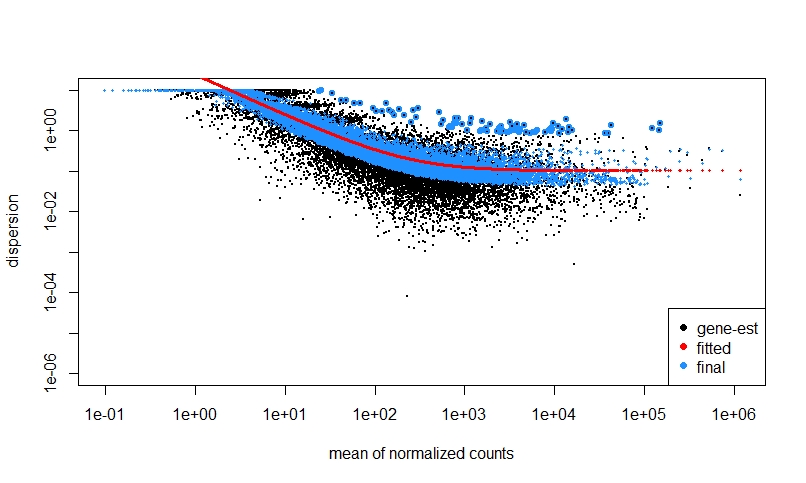
The fact that on the left side of the dispersion plot you have many features with mean of < 10 counts and their dispersion is at the limit in the y-axis (the limit is due to the maximal ratio of SD to mean for positive valued data).
Generally, I tend to remove features with single digit counts for all samples.
Thank you very much for explaining that. It is much appreciated.