
Hello!
I have been using limma to analyse a relatively large multiomics dataset (RNA-Seq and 850k methylation array) of paired-samples. The paired pairwise-comparisons have been going smoothly (using the duplicateCorrelations approach), however, I now want to find genes whose expression is associated with a continuous predictor (Waist-to-Hip ratio). I have done this successfully before for all my samples together, but I am now struggling to do this within some groups of interest (male abdominal, male gluteal, female abdominal, female gluteal). To be clear: I want to find genes whose expression is significantly associated with waist-to-hip ratio in abdominal and gluteal tissues of males and females, each considered separately. My code is shown below (where targets$sex.depot is one of male.abdominal, male.gluteal, female.abdominal, or female.gluteal);
design.WHR <- model.matrix(~new.WHR:sex.depot + machine + age.at.Biopsy + Cell.type1 + Cell.type2 + Cell.type3 + Cell.type4 + Cell.type5, data = targets)
counts_voom.whr <- voomWithQualityWeights(myDGEList.filtered.norm,design.WHR)
fit.whr <- lmFit(counts_voom.whr, design.WHR)
ebFit.whr <- eBayes(fit.whr, robust = TRUE)
results.whr <- decideTests(ebFit.whr, method="separate", adjust.method="BH", p.value=0.001, lfc=0)
topTable(ebFit.whr, adjust ="BH", coef="new.WHR:sex.depotabdominal.female", number=40000, sort.by="none")
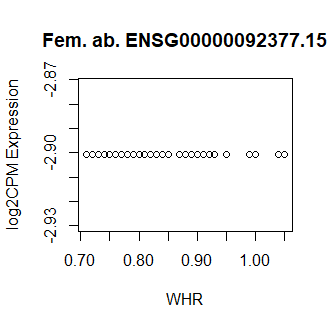
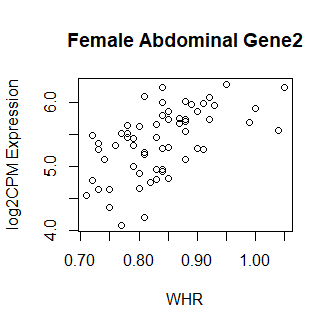
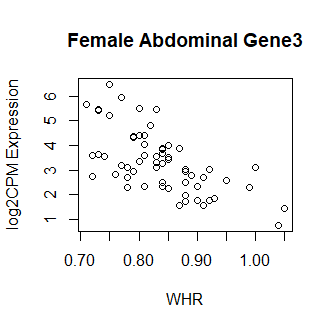
This code produces unusual results. Shown below are three of the top 15 most significant results from female abdominal: adjusted p values < 10^-25.
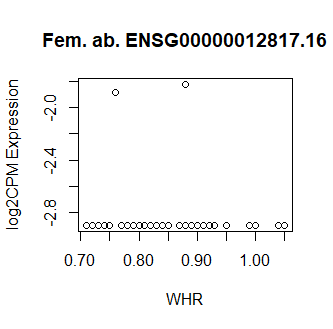
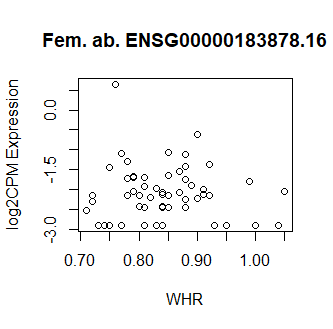
Clearly something has not worked. However, after this top 15 or so, the subsequent results all look proper, as shown below. Furthermore, the results are broadly consistent with those I get when I simply correlate expression with WHR in each tissue.
So, why are my top hits so weird looking? What have I done wrong? Your guidance is greatly appreciated! Thank you in advance.
P.S Apologies if I made any mistakes - this is my first post!

Thanks for your clarification Gordon. Yes you are right, I missed a line of code calling topTable (to pull out female abdominal results), which I've now included in my original post.
Thanks for directing me to 8.2 in your design matrix guide. Following that scheme, my model would look like;
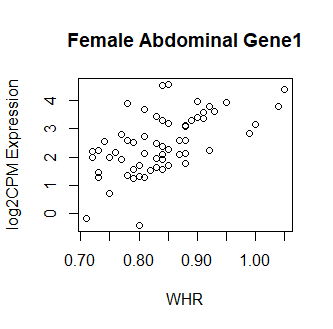
This seems to have worked i.e. all significant results look like real associations when plotted in the correct sex:tissue, with no funky stuff. Thank you!
You raise a good point about sample pairings, which I had planned to ask as a follow-up. I have added duplicateCorrelation values
block=targets$individual, correlation=corfit$consensusback into voomWithQualityWeights in the normal way.After reading Limma time series spline help, and given I have decent sample sizes (~32 for each sex.depot block), I am wondering if you think exploring using the spline method,
might help me to to capture even more meaningful associations. What do you think?
Thanks again,
Dan
No, judging from the plots you show, a 5-parameter spline would be overkill. You only have vague correlations and anything more than 2 parameters seems unnecessary.
You can't fit a spline and include WHR in your model as well.
Thanks again Gordon. I've now produced some results that appear to be sensical and I'm happy with.
I was hoping I could steal one final answer from you about the interpretability of these results. I am aware that (e.g. from your answer here: https://www.biostars.org/p/383626/) that the logFC for a continuous predictor is the FC in log expression per unit increase of the predictor e.g. per 1 year, for age. However, my predictor is a ratio (waist circumference in cm/hip circumference in cm), ranging from ~0.7 to ~1. Some of my logFC values are large (e.g. 10) and I get the impression limma is basing this off a change in WHR of 1. Does this sound correct? If so I plan to divide by 10 to increase interpretability but thought I'd clarify first.
Best wishes, Dan