ClusterProfiler dotplot mapping fold change to colour of dots
1
0
Entering edit mode
Colin • 0
@d0b7f29e
Last seen 2.0 years ago
Denmark

I would like to colour a dotplot of top 20 enriched biological processes by the median fold change of the genes in each category. The fold change of all genes in the enrichment analysis are provided by a separate vector style list that has entrez IDs associated, fold changes are from an experimentally derived dataset. I think this requires some workaround. Thanks in advance for your help!!

My dot plot displays fine but the colour specified by the color = "median(dataFrame_FC)" does not work. It defaults back to p.adjust. I get the following error: Error in match.arg(color, c("pvalue", "p.adjust", "qvalue")) : 'arg' should be one of “pvalue”, “p.adjust”, “qvalue”


# include your problematic code here with any corresponding output 

genes = dataframe$EntrezID
foldChange = dataframe$Difference
names(foldChange) = as.character(dataframe$EntrezID)
dataframe_FC = sort(foldChange, decreasing = FALSE)

egoBP <- enrichGO(gene          = genes,
                                  OrgDb         = org.Hs.eg.db,
                                  ont           = "BP",
                                  pAdjustMethod = "BH",
                                  pvalueCutoff  = 0.01,
                                  qvalueCutoff  = 0.05)

  dotplot(
    egoBP,
    x = "GeneRatio",
    color = "median(dataFrame_FC)",
    showCategory = 20,
    size = NULL,
    split = NULL,
    font.size = 12,
    title = "",
    label_format = 30,
  )

sessionInfo(R version 4.0.3 (2020-10-10)
Platform: x86_64-apple-darwin17.0 (64-bit)
Running under: macOS Big Sur 10.16

Matrix products: default
LAPACK: /Library/Frameworks/R.framework/Versions/4.0/Resources/lib/libRlapack.dylib

locale:
[1] en_GB.UTF-8/en_GB.UTF-8/en_GB.UTF-8/C/en_GB.UTF-8/en_GB.UTF-8

attached base packages:
[1] stats4    parallel  stats     graphics  grDevices utils     datasets 
[8] methods   base     

other attached packages:
 [1] scales_1.1.1           ggupset_0.3.0          tree_1.0-41           
 [4] aplot_0.1.3            enrichplot_1.10.2      DOSE_3.16.0           
 [7] ggnewscale_0.4.7       clusterProfiler_3.18.1 units_0.8-0           
[10] org.Hs.eg.db_3.12.0    AnnotationDbi_1.52.0   IRanges_2.24.1        
[13] S4Vectors_0.28.1       Biobase_2.50.0         BiocManager_1.30.16   
[16] ExperimentHub_1.16.1   AnnotationHub_2.22.1   BiocFileCache_1.14.0  
[19] dbplyr_2.1.1           BiocGenerics_0.36.1    depmap_1.4.0          
[22] stringr_1.4.0          gridExtra_2.3          tibble_3.1.6          
[25] viridis_0.6.2          viridisLite_0.4.0      ggplot2_3.3.5         
[28] dplyr_1.0.8           

loaded via a namespace (and not attached):
 [1] fgsea_1.16.0                  colorspace_2.0-3             
 [3] ellipsis_0.3.2                rprojroot_2.0.3              
 [5] qvalue_2.22.0                 rstudioapi_0.13              
 [7] farver_2.1.0                  remotes_2.4.2                
 [9] graphlayouts_0.8.0            ggrepel_0.9.1                
[11] bit64_4.0.5                   interactiveDisplayBase_1.28.0
[13] fansi_1.0.3                   scatterpie_0.1.7             
[15] splines_4.0.3                 cachem_1.0.6                 
[17] GOSemSim_2.16.1               polyclip_1.10-0              
[19] GO.db_3.12.1                  ggforce_0.3.3                
[21] shiny_1.7.1                   compiler_4.0.3               
[23] httr_1.4.2                    rvcheck_0.2.1                
[25] assertthat_0.2.1              Matrix_1.4-1                 
[27] fastmap_1.1.0                 cli_3.2.0                    
[29] later_1.3.0                   tweenr_1.0.2                 
[31] prettyunits_1.1.1             htmltools_0.5.2              
[33] tools_4.0.3                   igraph_1.3.0                 
[35] gtable_0.3.0                  glue_1.6.2                   
[37] reshape2_1.4.4                DO.db_2.9                    
[39] rappdirs_0.3.3                fastmatch_1.1-3              
[41] Rcpp_1.0.8.3                  vctrs_0.4.1                  
[43] ggraph_2.0.5                  ps_1.6.0                     
[45] mime_0.12                     lifecycle_1.0.1              
[47] MASS_7.3-56                   tidygraph_1.2.1              
[49] promises_1.2.0.1              RColorBrewer_1.1-3           
[51] yaml_2.3.5                    curl_4.3.2                   
[53] memoise_2.0.1                 downloader_0.4               
[55] ggfun_0.0.6                   yulab.utils_0.0.4            
[57] stringi_1.7.6                 RSQLite_2.2.12               
[59] BiocVersion_3.12.0            pkgbuild_1.3.1               
[61] BiocParallel_1.24.1           rlang_1.0.2                  
[63] pkgconfig_2.0.3               lattice_0.20-45              
[65] purrr_0.3.4                   patchwork_1.1.1              
[67] labeling_0.4.2                processx_3.5.3               
[69] cowplot_1.1.1                 shadowtext_0.1.1             
[71] bit_4.0.4                     tidyselect_1.1.2             
[73] plyr_1.8.7                    magrittr_2.0.3               
[75] R6_2.5.1                      generics_0.1.2               
[77] DBI_1.1.2                     pillar_1.7.0                 
[79] withr_2.5.0                   crayon_1.5.1                 
[81] utf8_1.2.2                    grid_4.0.3                   
[83] data.table_1.14.2             blob_1.2.3                   
[85] callr_3.7.0                   digest_0.6.29                
[87] xtable_1.8-4                  tidyr_1.2.0                  
[89] httpuv_1.6.5                  gridGraphics_0.5-1           
[91] munsell_0.5.0                 ggplotify_0.1.0  )
clusterProfiler • 3.8k views
ADD COMMENT
0
Entering edit mode
Guido Hooiveld ★ 3.9k
@guido-hooiveld-2020
Last seen 6 hours ago
Wageningen University, Wageningen, the …

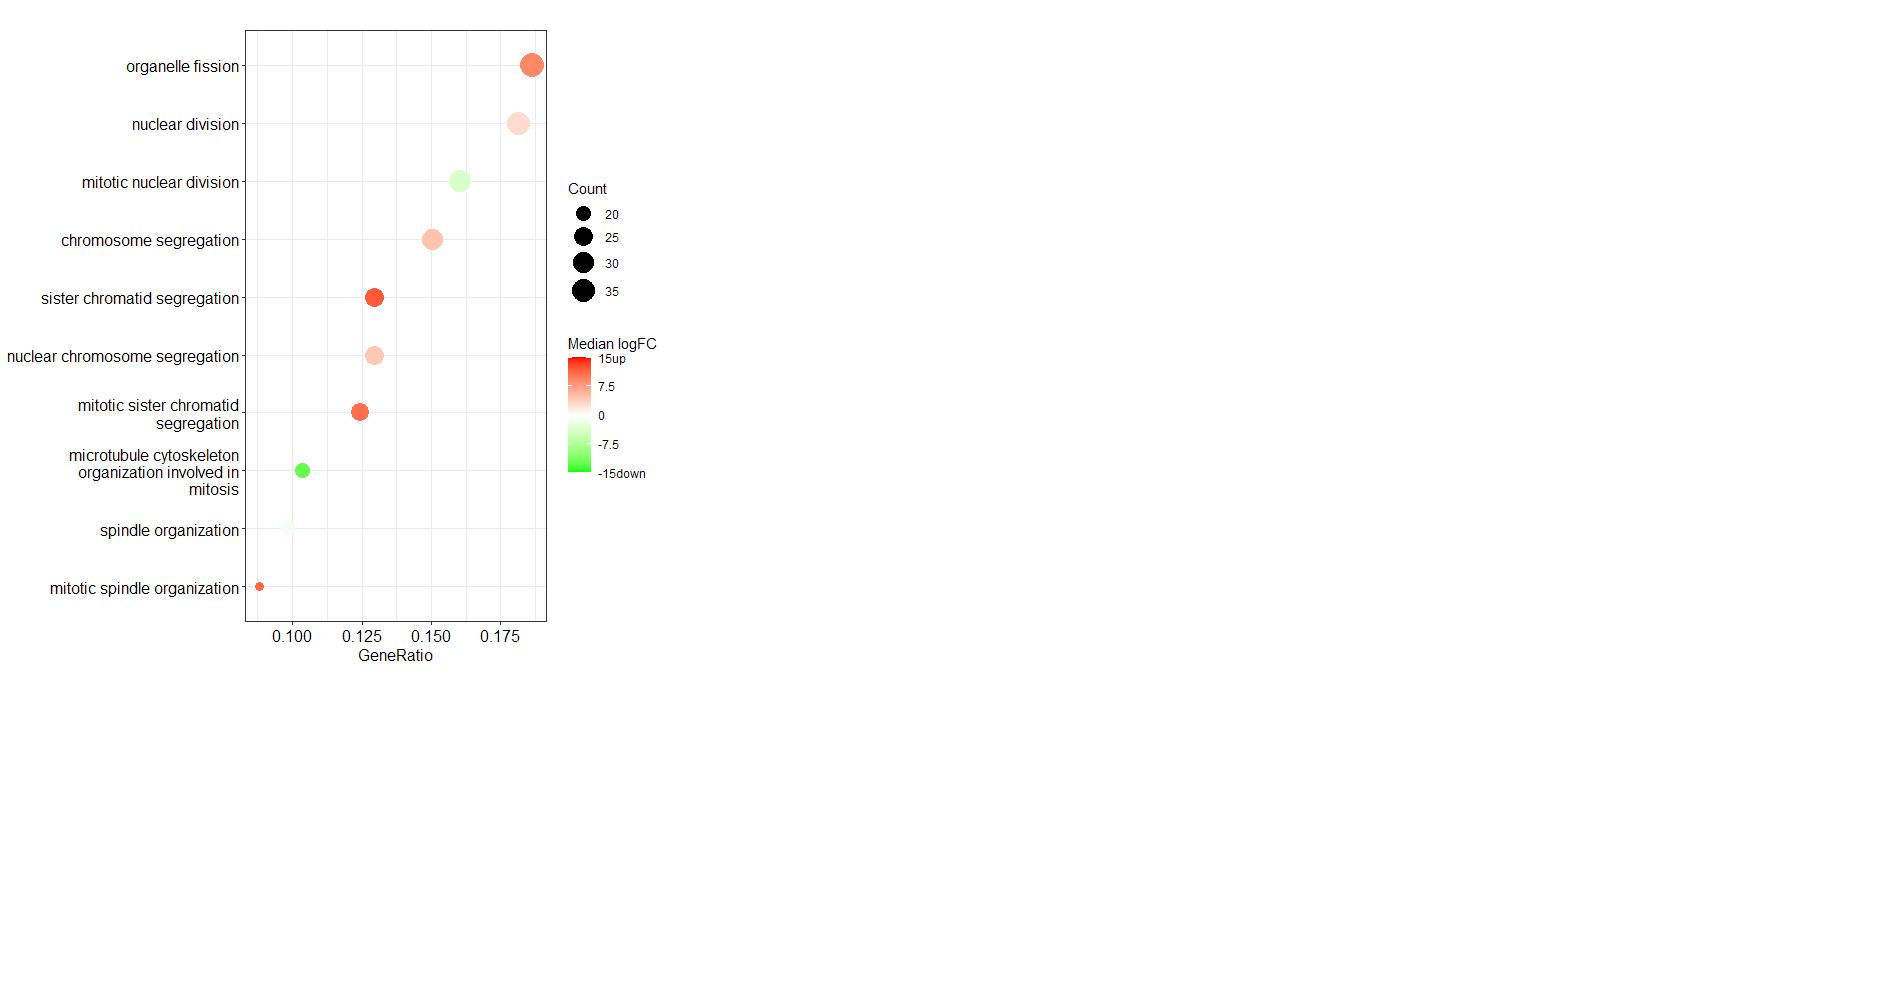
Indeed, to obtain what you want, I think it is easiest if you add the median fold change values to the output of the enrichGO function, and also use the default generated dotplot as input for another (2nd) call to functions of the ggplot2 library.

Key to realize are:

  • the output of the function dotplot is a ggplot object.
  • as you have noticed, the function dotplot only accepts one of these three arguments ("pvalue", "p.adjust", "qvalue"). Thus, after generating the default dotplot it should be modified to plot the median FC values using another color scale.
  • most convenient is to add the values you would like to plot (median fold changes) to the output (results slot) of the function enrichGO. Since there are no functions implemented to do this neat and nicely, this has to be enforced by using the @ accessor. Please note that using this accessor to directly access object slots is normally not recommended. Also note that by going this way you will need to calculate the median fold changes for all GO categories, and not only the top 20 or so...

Below some code to show you one way of achieving what you would like.

Be sure to also check out the paper on clusterProfiler 4.0, as part of this paper also deals with modifying the default graphs. Link: https://doi.org/10.1016/j.xinn.2021.100141

# load required libraries
library(clusterProfiler)
library(enrichplot)

# Use the example data set included with the package DOSE
data(geneList, package="DOSE")

# Set fold change > 2 as being DE genes
de <- names(geneList)[abs(geneList) > 2]
ego <- enrichGO(de, OrgDb = "org.Hs.eg.db", ont="BP", readable=TRUE)

# Until here, this was a standard enrichGO analysis

# Generate the median fold changes vector.
# Note that for EACH GO term in 'ego' a median fold change has to be calculated.
# In this example median fold changes, ranging from -15 to 15, are randomly generated
# for all 2987 GO categories analyzed/present in the object ego.
# These values will be used as colors.
# The median fold change values will be added to the output slot of enrichGO using the @
# accessor. Doing it like this is normally not recommended.

# Generate vector with (random) median FC values for all 2987 GO categories
# that have been analyzed.
median.FC.values <- runif(n = dim( ego@result)[1] , min=-15, max = 15)

# Although not explicitly needed here, names of vector
# should be ids of ALL GO categories.
names(median.FC.values) <- rownames(ego@result)

# Add values to results slot of ego.
ego@result$medianFC <-  median.FC.values

# Check (added values should be in last column).
# Note that ego@result contains results for all GO categories.
head(ego@result)
tail(ego@result)

# Note that as.data.frame(ego) shows only results for *significant*
# GO categories. Default cutoff is p.adjust <0.05.
head(as.data.frame(ego))
tail(as.data.frame(ego))


# Create default dotplot, and store in object p.
# Note that plots (p) can be viewed by just typing 'p'
p <-  dotplot(ego, color = "p.adjust")
p

# Now plot the median FC values using plot 'p' as input together with 
# another color scale, for example, green-white-red.
# To make scale symmetric, range of colors can be set (-15 to 15),
# as well as location of breaks at color scale, and corresponding labels
# (note that I added some letters to the labels).
# In the last line the titles of the legend boxes are renamed.
library(ggplot2)
p <- p + geom_point(aes_string(colour = "medianFC") ) +
    scale_colour_gradient2(low="green", mid="white", high="red",
      limits = c(-15, 15),
      breaks = c(-15, -7.5, 0, 7.5, 15),
      labels = c("-15down", "-7.5", "0", "7.5", "15up"),  
          guide=guide_colorbar(reverse=TRUE) )  +
    labs(size="Count", colour="Median logFC")

# save plot p as PDF.
ggsave(
   filename = "dotplot.with.medianLogFC.pdf", 
   )

Output: enter image description here

ADD COMMENT
0
Entering edit mode

Is it possible to get this in RT-qPCR results (fold change as well, meant by 2^ dCt). I am really confused about the utility of cluster profile.

My dataset is made up 55 genes and about 150 samples (twice, pre and post-) Thanks in advance

ADD REPLY

Login before adding your answer.

Traffic: 967 users visited in the last hour
Help About
FAQ
Access RSS
API
Stats

Use of this site constitutes acceptance of our User Agreement and Privacy Policy.

Powered by the version 2.3.6